
Image
|
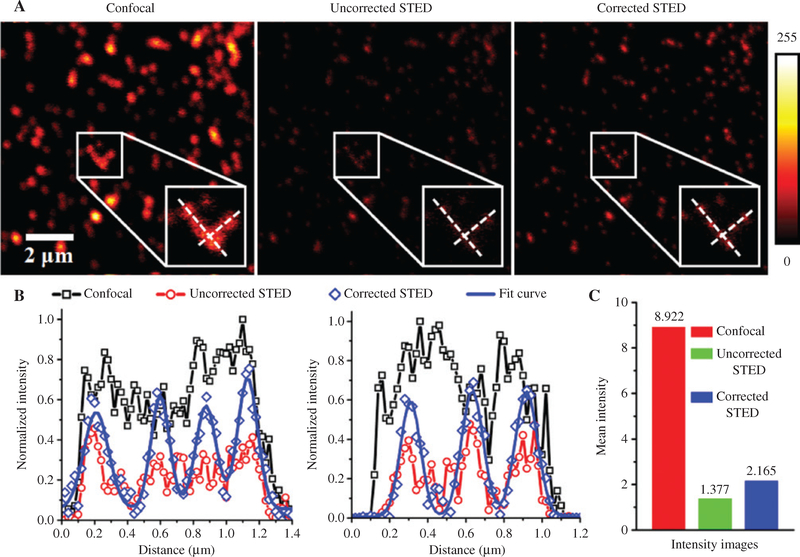
Figure Caption
Figure 5:
The improvement of image quality of fluorescent microspheres in STED microscopy.
(A) Confocal and STED images at the depletion power of 19 mW before and after correcting system-induced aberration. (B) Normalized intensity profiles along two white dotted lines in (A), respectively. (C) The mean intensity of three fluorescence images.
Acknowledgments
This image is the copyrighted work of the attributed author or publisher, and
ZFIN has permission only to display this image to its users.
Additional permissions should be obtained from the applicable author or publisher of the image.
Full text @ Nanophotonics