
FIGURE
Figure 8:
- ID
- ZDB-FIG-200306-8
- Publication
- Wang et al., 2018 - Aberration correction for improving the image quality in STED microscopy using the genetic algorithm
- Other Figures
- All Figure Page
- Back to All Figure Page
Figure 8:
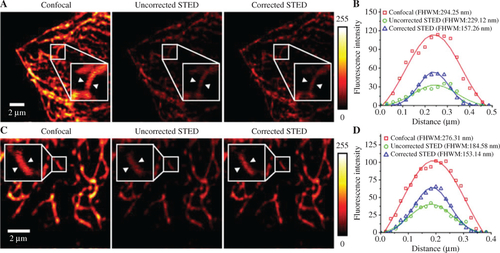
Full aberration correction in Hela cell sample. (A) Images of tubulin structures in a HeLa cell labeled with ATTO647N in the field of view of 15 × 15 μm2. (B) Fluorescence intensity profiles marked by white arrows in (A). (C) Images of tubulin structures in a HeLa cell labeled with ATTO647N in the field of view of 10 × 10 μm2. (D) Fluorescence intensity profiles marked by white arrows in (C). |
Expression Data
Expression Detail
Antibody Labeling
Phenotype Data
Phenotype Detail
Acknowledgments
This image is the copyrighted work of the attributed author or publisher, and
ZFIN has permission only to display this image to its users.
Additional permissions should be obtained from the applicable author or publisher of the image.
Full text @ Nanophotonics