FIGURE SUMMARY
Title

Integrative systems and functional analyses reveal a role of dopaminergic signaling in myelin pathogenesis

Authors
Ding, S., Gu, Y., Cai, Y., Cai, M., Yang, T., Bao, S., Shen, W., Ni, X., Chen, G., Xing, L.
Source
Full text @ J Transl Med

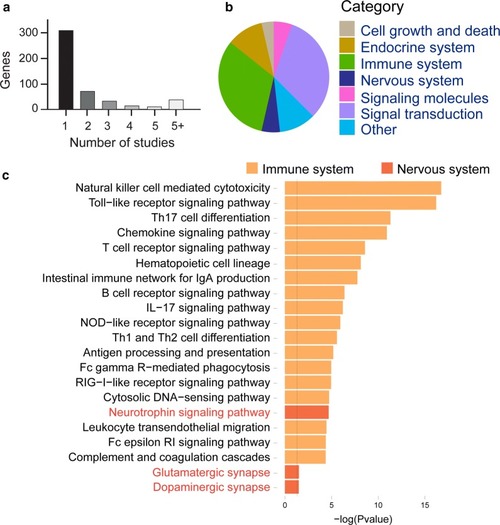
Functional enrichment analysis of literature-curated (LC) genes in multiple sclerosis (MS). a Number of studies about genes associated with multiple sclerosis (MS) in literature-curated (LC) genes. b Main categories aggregated by the enriched KEGG pathway. c Pathways of the immune system and nervous system are enriched in the LC gene set

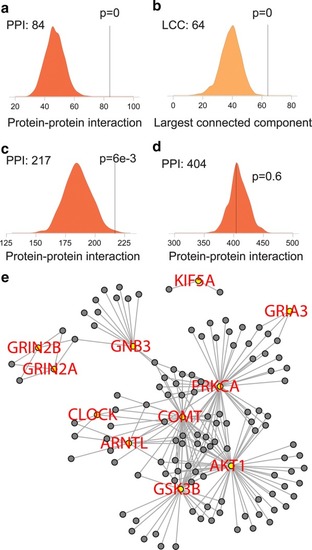
Networks between DS and other literature-curated (oLC) genes in MS. a, b in the high-confidence human interactome database. a Number of protein–protein interactions (PPIs) between DS and oLS (Line) and 1000 randomized networks, revealing high levels of interaction between DS and oLS. b Size of the largest connected component (LCC) between DS and oLS (Line) and 1000 randomized networks, revealing a larger subnetwork between DS and oLS. c, d In the Pathway Commons database. Number of protein–protein interactions (PPIs) between DS and oLS (Line) and 1000 randomized networks with the DS gene set as upstream (c) or downstream (d). e Gene interaction between DS and oLC genes in MS. Yellow nodes-DS genes; Grey nodes-oLC genes. Edges represent their interaction

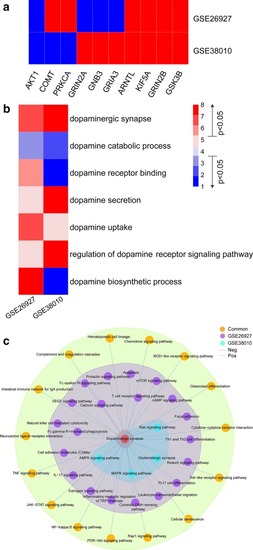
Transcriptome analysis of the DS gene set.
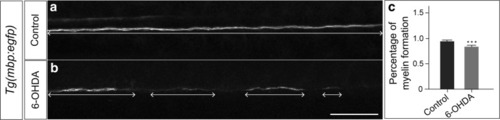
 a Expression of genes in the DS pathway in the transcription datasets GSE26927 and GSE38010. Red corresponds to upregulated expression; blue corresponds to downregulated expression. b Expression changes of multiple dopaminergic gene sets. Red represents upregulation; blue represents downregulation. Numbers 1–3 and 6–8 indicate p values < 0.05. c Pathway associations between DS and oLC in two transcriptome databases

6-OHDA disrupts myelin. a, bTg (mbp:egfp) at 72hpf by confocal microscopy imaging, maximum intensity z-stack projections. a Control. b Embryos treated with 6-OHDA. c Percentage of myelin formation along the tract (unpaired t test, p = 0.0037). N = 32 for the control, and N = 28 for the group treated with 6-OHDA

otp crispants have disrupted myelin. a, b An example of Sanger sequencing shows that otpa and otpb genes were disrupted after injection with CRISPR/Cas9. The sgRNA sequence is underlined in red. c Percentage of in-frame and out-of-frame mutations from otpa and otpb PCR amplicons (all PCR products have mutations). d Representative sequences from individually cloned PCR products. The sgRNA sequence is underlined in red. Insertions and deletions are shown as red letters and dashes, respectively. e, fTg (mbp:egfp) at 72hpf by confocal microscopy imaging. e control. fotp crispant. g h Quantification of myelin deficits. N = 12 for the control group, and N = 15 for the otp crispant group. g Percentage of myelin formation along the tract (unpaired t test, p = 0.0001). Two-headed arrows (e, f) show the intact myelin. The lengths of intact myelin are added and the percentage is calculated by dividing by the length of the entire image window. The same threshold is set in each z projection for each embryo, and the length is calculated for visible segments. h Thickness of myelin sheaths (unpaired t test, p = 0.0045). The red box (e, f) is drawn around the visible myelin and the height of the box was used to calculate the thickness of the myelin sheaths. i ELISA shows that the dopamine levels (ng dopamine/larvae weight) are decreased in otp crispants (unpaired t test, p = 0.0079)

Acknowledgments
This image is the copyrighted work of the attributed author or publisher, and ZFIN has permission only to display this image to its users. Additional permissions should be obtained from the applicable author or publisher of the image. Full text @ J Transl Med