IMAGE

Fig. 2

ID
ZDB-IMAGE-200312-2
Source
Figures for Ding et al., 2020
Image
Figure Caption

Fig. 2

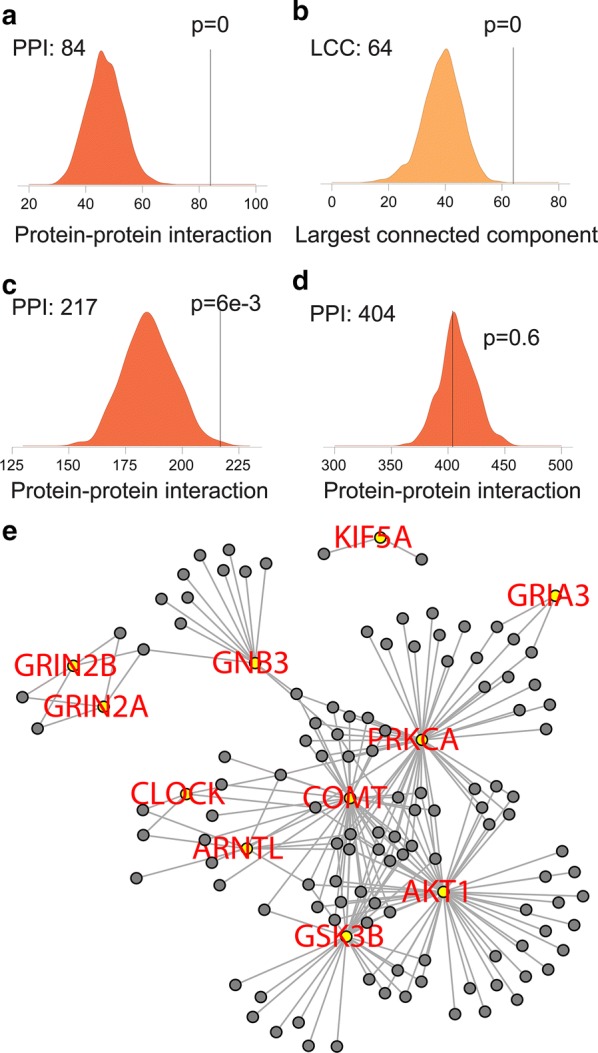
Networks between DS and other literature-curated (oLC) genes in MS. a, b in the high-confidence human interactome database. a Number of protein–protein interactions (PPIs) between DS and oLS (Line) and 1000 randomized networks, revealing high levels of interaction between DS and oLS. b Size of the largest connected component (LCC) between DS and oLS (Line) and 1000 randomized networks, revealing a larger subnetwork between DS and oLS. c, d In the Pathway Commons database. Number of protein–protein interactions (PPIs) between DS and oLS (Line) and 1000 randomized networks with the DS gene set as upstream (c) or downstream (d). e Gene interaction between DS and oLC genes in MS. Yellow nodes-DS genes; Grey nodes-oLC genes. Edges represent their interaction

Acknowledgments
This image is the copyrighted work of the attributed author or publisher, and ZFIN has permission only to display this image to its users. Additional permissions should be obtained from the applicable author or publisher of the image. Full text @ J Transl Med