FIGURE SUMMARY
Title

Loss-of-function mutations in UDP-Glucose 6-Dehydrogenase cause recessive developmental epileptic encephalopathy

Authors
Hengel, H., Bosso-Lefèvre, C., Grady, G., Szenker-Ravi, E., Li, H., Pierce, S., Lebigot, É., Tan, T.T., Eio, M.Y., Narayanan, G., Utami, K.H., Yau, M., Handal, N., Deigendesch, W., Keimer, R., Marzouqa, H.M., Gunay-Aygun, M., Muriello, M.J., Verhelst, H., Weckhuysen, S., Mahida, S., Naidu, S., Thomas, T.G., Lim, J.Y., Tan, E.S., Haye, D., Willemsen, M.A.A.P., Oegema, R., Mitchell, W.G., Pierson, T.M., Andrews, M.V., Willing, M.C., Rodan, L.H., Barakat, T.S., van Slegtenhorst, M., Gavrilova, R.H., Martinelli, D., Gilboa, T., Tamim, A.M., Hashem, M.O., AlSayed, M.D., Abdulrahim, M.M., Al-Owain, M., Awaji, A., Mahmoud, A.A.H., Faqeih, E.A., Asmari, A.A., Algain, S.M., Jad, L.A., Aldhalaan, H.M., Helbig, I., Koolen, D.A., Riess, A., Kraegeloh-Mann, I., Bauer, P., Gulsuner, S., Stamberger, H., Ng, A.Y.J., Tang, S., Tohari, S., Keren, B., Schultz-Rogers, L.E., Klee, E.W., Barresi, S., Tartaglia, M., Mor-Shaked, H., Maddirevula, S., Begtrup, A., Telegrafi, A., Pfundt, R., Schüle, R., Ciruna, B., Bonnard, C., Pouladi, M.A., Stewart, J.C., Claridge-Chang, A., Lefeber, D.J., Alkuraya, F.S., Mathuru, A.S., Venkatesh, B., Barycki, J.J., Simpson, M.A., Jamuar, S.S., Schöls, L., Reversade, B.
Source
Full text @ Nat. Commun.

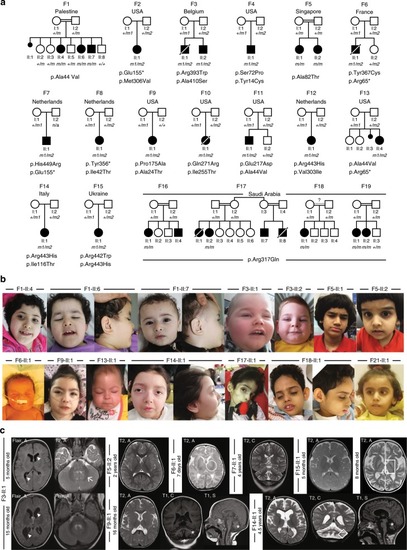
Clinical and genetic findings in 21 affected individuals diagnosed with Jamuar Syndrome consisting of developmental epileptic encephalopathy.

a Pedigrees of 19 families segregating autosomal recessive developmental epileptic encephalopathy. Countries of origin are specified above each pedigree. Filled black symbols, affected individuals. Crossed symbols, deceased individual. Mutations in UGDH protein are presented below pedigrees. Homozygous mutations are presented in bold (m in the pedigrees). Compound heterozygous mutations are presented according to the parental origin of the mutation with a maternal origin in the first row (m1 in the pedigrees), and a paternal, de novo or unknown origin in the second row (m2 in the pedigrees). Healthy siblings that could be sequenced are heterozygous [F6-II:2 (p.Arg65*), F11-II:2 (p.Ala44Val), and F18-II:3 (p.Arg317Gln)]. b Facial photographs of 14 affected individuals with mild craniofacial dysmorphisms, including short and flattened philtrum, protruding earlobes, ptosis blepharophimosis, and epicanthic folds. c Spectrum of MRI findings in exemplary patients showing no evidence for maldevelopment but displaying variable abnormalities ranging from abnormal myelination and/or cerebral or cerebellar atrophy, to normal findings. Patient F5-II:2 presented with a normal MRI, including normal myelination at 2 years of age. In contrast, MRI of patient F3-II:1 revealed some myelination of cerebellar peduncles at 5 months (arrow) and no progress of myelination on follow-up at 15 months, indicative of hypomyelination. In addition, repeated MRI revealed enlarged posterior ventricles over time (arrow heads). MRI of patient F6-II:1 at 7 days of age also proved normal, the circle indicates onset of myelination in the Posterior Limb of the Internal Capsule (PLIC) according to age. Patient F7-II:1 showed mild cerebellar atrophy at 4 years of age. Patient F9-II:1 showed slightly delayed myelination on axial T2 and cerebellar atrophy on coronal and sagittal T1 images (stars). Patient F14-II:1 showed a diffuse cerebral atrophy, ventriculomegaly, thin corpus callosum, vermian, and lobar cerebellar atrophy, with normal brainstem, hyperintensity of cerebellar cortex in T2-weighted images (white square). Patient F15-II:1 presented with normal MRI at 5 months, but with severe diffuse atrophy, bilateral symmetrical hyperintensities of thalami and globus pallidus (white square) at 8 months old. In all pictures, MRI pulse sequences (T1, T2, and Flair) and image orientation (S: sagittal, A: axial and C: coronal) are indicated in the upper left corner.

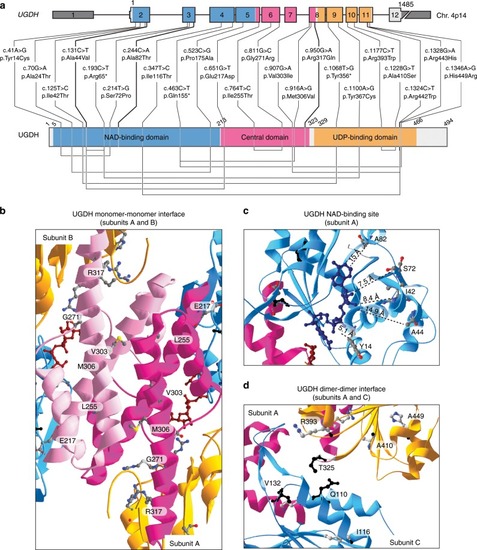
Mutations in UGDH enzyme possibly affect critical amino-acids.

aUGDH genomic and protein domain structures. Type and positions of 22 germline UGDH mutations. 5′ and 3′ UTRs are shown in dark gray. NAD-binding (blue), central (pink), and UDP-binding (orange) domains are highlighted. Homozygous mutations are shown in bold. Compound heterozygous mutations that are in trans are linked by a line below the UGDH domain structure. bd Three close-up views ribbon diagrams of the UGDH protein bound to UDP-Glc and NADH. b Interface between the central domains of subunits A and B. c NAD-binding site in NAD-binding domain of subunit A. Distances between NADH and mutated residues in patients are measured in Angström (Å). d Interface between the subunit A NAD-binding domain with the subunit C UDP-Glc-binding domain. In all the structures, residues carrying missense mutations in the patients are highlighted as 3D backbone. Residues Q110 and T325 known to interact together for dimer formation15; and residue V132, which is important for hexamerization15 are highlighted in black backbone. In all the structures, NAD-binding (blue), central (light/dark pink), and UDP-binding (orange) domains are shown. UDP-Glc (dark red) and NADH (midnight blue) are represented as colored carbon backbones. Adapted from PDB code 2Q3E6 using the Swiss-Pdb Viewer software67. For gels and graphs source data, please refer to the source data files 1 and 2.

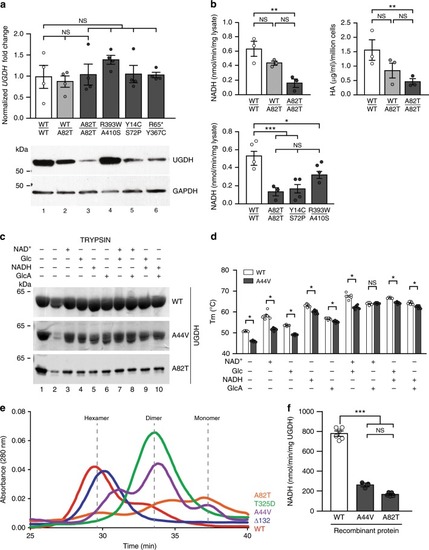
Biallelic UGDH mutations behave as hypomorphic alleles.

a RT-qPCR (top), western blotting (bottom), and b enzymatic activity, assessed by measuring NADH production (left panel) and quantification of HA (right panel), for endogenous UGDH using patient-derived primary fibroblasts. a, b Control (WT/WT), unaffected mother F5-I:1 (WT/A82T) and 4 (in a) or 3 (in b) different patients’ fibroblasts (F5-II:1: A82T/A82T, F3-II:1: R393W/A410S, F4-II:1: Y14C/S72P, and F6-II:1: R65*/Y367C). a (top) Endogenous UGDH mRNA levels are normalized to β-ACTIN and GAPDH. Fold change relative to control (WT/WT) is plotted. a (bottom) Western blot analysis for endogenous UGDH protein using cellular extracts. GAPDH is used as a loading control. b (left) UGDH enzymatic activity measured as the conversion of NAD+ to NADH in whole-cell lysates. b (right) UGDH enzymatic activity measured as the HA production in conditioned media from primary fibroblast cultures. c Western blot analysis for UGDH sensitivity to limited proteolysis using purified WT and mutant (A44V and A82T) UGDH proteins in the absence or presence of its substrates and/or cofactors, as indicated. Results are representative of at least three experimental replicates. d Purified UGDH WT and A44V melting temperature (Tm) in the absence or presence of its substrates and/or cofactors, as indicated. Mean of three experiments ± S.D. is plotted for the Tm of each enzyme. e Representative traces at λ = 280 nm of purified WT and mutant UGDH proteins fractionated by size exclusion chromatography. WT, obligate dimer ∆13215, obligate hexamer T325D15, A44V and A82T UGDH are plotted in the graph. Dashed lines correspond to the known hexamer, dimer and monomer peak elution times. f Purified WT, A44V, and A82T UGDH enzymatic activity measured as the conversion of NAD + to NADH. Asterisks indicate p-values of p < 0.05(*), p < 0.01(**), and p < 0.001(***), NS: non-significant (p > 0.05) as determined by Student t-test. For gels and graphs source data, please refer to the source data files 1 and 2.

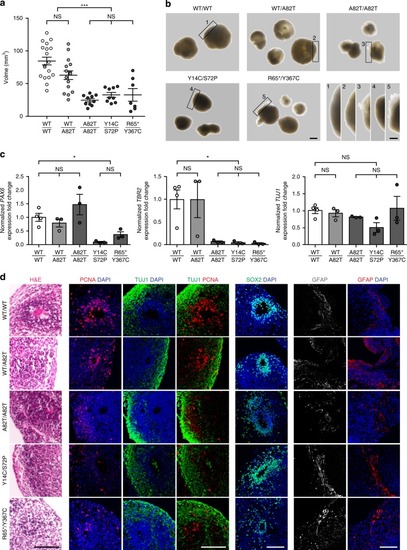
Patient-derived cerebral organoids are underdeveloped.

a Volumes (mean ± SD) and b representative images (scale bar = 1 mm) of cerebral organoids derived from iPSCs from WT (n = 18 organoids from the same batch), unaffected parent (UGDH WT/A82T, n = 15), and patients (UGDH A82T/A82T (n = 10), Y14C/S72P (n = 7), and R65*/Y367C (n = 6) after 10 weeks of differentiation. Lower right panel: close-up views of the edges of indicated cerebral organoids. Scale bar = 500 μm. c RT-qPCR for neuronal differentiation markers (PAX6, TBR2, and TUJ1) in WT (n = 4 cerebral organoids), unaffected parent (WT/A82T, n = 3), and patients (A82T/A82T, Y14C/S72P, and R65*/Y367C, n = 3 each) cerebral organoids. Levels of expression are normalized to GAPDH. Mean ± SD fold change relative to WT is plotted. d Representative images of consecutive sections of cerebral organoids derived from iPSCs from WT (N = 5 cerebral organoids, n = 40 ventricle-like zones), unaffected parent (WT/A82T, N = 4, n = 15), and patients (A82T/A82T N = 3, n = 40, Y14C/S72P N = 4, n = 18, and R65*/Y367C N = 2, n = 9) stained with H&E, and immunostained with markers TUJ1/PCNA/DAPI, SOX2/DAPI, and GFAP/DAPI. Scale bar = 100 μm. a, c Asterisks indicate p-values of p < 0.05(*), p < 0.001(***), NS: non-significant (p > 0.05) as determined by ANOVA test with Bonferroni correction. ac Cerebral organoids represented here are all from batch 2 and derived from iPSCs clone 1 for each genotype, see Suppl. Fig. 4 for more information. For graphs source data, please refer to the source data file 2.

ZFIN is incorporating published figure images and captions as part of an ongoing project. Figures from some publications have not yet been curated, or are not available for display because of copyright restrictions.

Acknowledgments
This image is the copyrighted work of the attributed author or publisher, and ZFIN has permission only to display this image to its users. Additional permissions should be obtained from the applicable author or publisher of the image. Full text @ Nat. Commun.