|
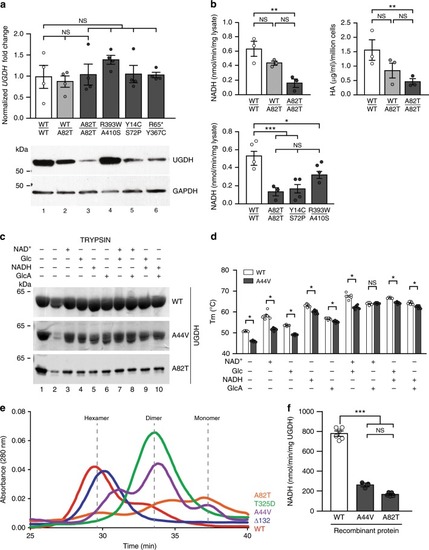
Biallelic UGDH mutations behave as hypomorphic alleles.a RT-qPCR (top), western blotting (bottom), and b enzymatic activity, assessed by measuring NADH production (left panel) and quantification of HA (right panel), for endogenous UGDH using patient-derived primary fibroblasts. a, b Control (WT/WT), unaffected mother F5-I:1 (WT/A82T) and 4 (in a) or 3 (in b) different patients’ fibroblasts (F5-II:1: A82T/A82T, F3-II:1: R393W/A410S, F4-II:1: Y14C/S72P, and F6-II:1: R65*/Y367C). a (top) Endogenous UGDH mRNA levels are normalized to β-ACTIN and GAPDH. Fold change relative to control (WT/WT) is plotted. a (bottom) Western blot analysis for endogenous UGDH protein using cellular extracts. GAPDH is used as a loading control. b (left) UGDH enzymatic activity measured as the conversion of NAD+ to NADH in whole-cell lysates. b (right) UGDH enzymatic activity measured as the HA production in conditioned media from primary fibroblast cultures. c Western blot analysis for UGDH sensitivity to limited proteolysis using purified WT and mutant (A44V and A82T) UGDH proteins in the absence or presence of its substrates and/or cofactors, as indicated. Results are representative of at least three experimental replicates. d Purified UGDH WT and A44V melting temperature (Tm) in the absence or presence of its substrates and/or cofactors, as indicated. Mean of three experiments ± S.D. is plotted for the Tm of each enzyme. e Representative traces at λ = 280 nm of purified WT and mutant UGDH proteins fractionated by size exclusion chromatography. WT, obligate dimer ∆13215, obligate hexamer T325D15, A44V and A82T UGDH are plotted in the graph. Dashed lines correspond to the known hexamer, dimer and monomer peak elution times. f Purified WT, A44V, and A82T UGDH enzymatic activity measured as the conversion of NAD + to NADH. Asterisks indicate p-values of p < 0.05(*), p < 0.01(**), and p < 0.001(***), NS: non-significant (p > 0.05) as determined by Student t-test. For gels and graphs source data, please refer to the source data files 1 and 2.
|