FIGURE SUMMARY
Title

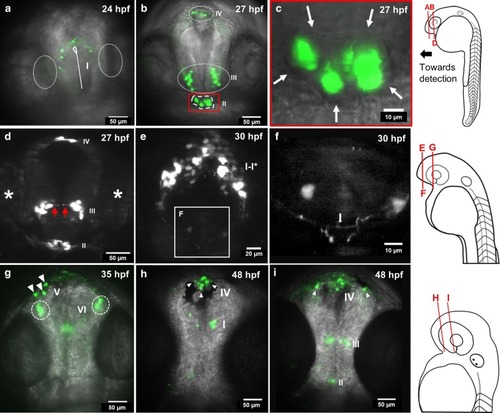
Patterns of spon1b:GFP expression during early zebrafish brain development

Authors
Agudelo-Dueñas, N., Forero-Shelton, M., Zhdanova, I.V., Akle, V.
Source
Full text @ BMC Res. Notes

spon1b:GFP expression in cell populations from 24 to 48 hpf in telencephalic and diencephalic regions. a Maximum intensity projection (MIP) of a 10 µm optical slice of GFP fluorescence (green) overlaid with a transmitted light image (gray) for anatomical reference. This MIP at the dorsal telencephalon shows population i. Olfactory placodes are circled for anatomical reference. Telencephalic ventricle is shown with a continuous white line. b MIP obtained from a 30 µm thick slice at the developing dorsal and ventral telencephalon and diencephalon, showing populations II, III and IV. Population II corresponds to the pituitary anlage (dashed line), identified adjacent to the ventral diencephalon using transmitted light images as anatomical reference. c Detail of the pituitary anlage enclosed in red in (b). Arrows outline the border of the pituitary anlage. d Cells in population III show a characteristic morphology along the neuroepithelium. The MIP of a 12 µm thick slice of cells in population III of a different individual shows prolongations along the developing neuroepithelium at 27 hpf (red arrows), but at the same approximate location as (b). White asterisks indicate eye position. e MIP obtained from a 60 µm slice showing the tips of axonal processes in the midline and commissure at the telencephalon from populations I–I*. f Detail of axonal processes and commissure (white arrow) enclosed in (e). g MIP obtained from a 75 µm slice at the dorsal diencephalon and tectum showing individual cells in newly identified population V (white arrowheads), and two bilateral clusters as VI (dashed circles). h MIP obtained from a 50 µm slice showing population I and IV (white arrowheads). i MIP obtained from a 90 µm slice showing populations II-IV. White arrowheads show cells from the olfactory system. Images from ai are frontal views. Schematic drawings of zebrafish embryos at the right show the approximate position of planes in ai

spon1b:GFP expression in cell populations from 48 to 96 hpf in telencephalic, diencephalic and hindbrain regions. Abbreviations: Hb, Habenula, dHb, dorsal habenula, TeO, Optic tectum, nMLF, Nuclei of the Medial Longitudinal Fasciculus, FO, Flexural Organ, a, Anterior, P, Posterior. a MIP color coded for a depth of 250 µm at 48 hpf. Cells in blue are part of the TeO. Cells in yellow are part of the developing Hb complex. Gamma was adjusted to a value of 0.75. b MIP color coded for a depth of 200 µm at 72 hpf. Cells in dark blue are part of the TeO. Cells in light blue are part of the developing Hb complex. Gamma was adjusted to a value of 0.75. c MIP color coded for a depth of 250 µm at 96 hpf. Gamma was adjusted to a value of 0.75. d MIP obtained from a 60 µm slice showing spon1b:GFP neurons in the hindbrain at 48 hpf. Rhombomeres (r3–6) are estimated by the position relative to the otocyst (oto). e MIP obtained from a 75 µm slice showing the Hb and the fasciculus retroflexus (red arrowheads) at 72 hpf. White asterisks indicate eye position. f Single plane showing an increased innervation at 96 hpf (red arrowheads). g Composite image of two MIPs obtained from a depth of 5 µm (cyan, depicting the vHb) and 20 µm (magenta depicting the dHb) at 48 hpf. Axons from the developing dHb are observed to project caudally, neighboring the nMLF (white arrows). Axons from the developing vHb project more caudally (white arrowheads), compared to axons from the dHb. Note the axons present within the tectal region. h Graph showing the average distance traveled by cells in the Hb subnuclei. The total distance traveled is significantly different (Mann–Whitney test, P value 0.0061) between cells in the dHb and the vHb subnuclei.. ad, fg are dorsal views. e is a lateral view

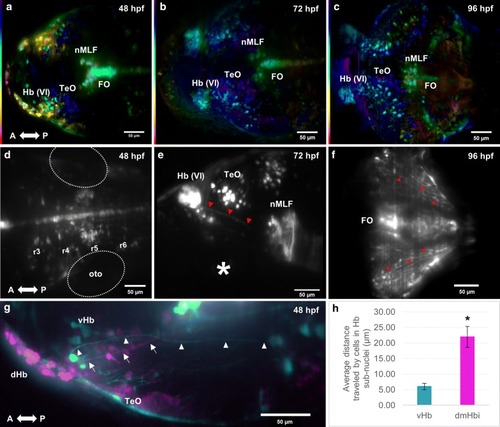
Development of the habenula from 48 to 73 hpf. Development of the Hb complex followed through time-lapse imaging. Cells within the dorsal habenula (dHb) aggregate progressively during development from an elongated shape to form a nucleus as indicated by the white arrowheads. The dHb is observed to be located more dorsally with respect to the vHb. Images from af are MIP color coded for a depth of 250 µm, purple and blue being more dorsal, and red and orange more ventral. Original stacks were cropped and aligned using the FiJi plugin Linear Stack Alignment with SIFT [20]. Gamma was adjusted to a value of 0.75. All time points are dorsal views. A, anterior, P, posterior

Acknowledgments
This image is the copyrighted work of the attributed author or publisher, and ZFIN has permission only to display this image to its users. Additional permissions should be obtained from the applicable author or publisher of the image. Full text @ BMC Res. Notes