
- Title
-
Motor Behavior Selectively Inhibits Hair Cells Activated by Forward Motion in the Lateral Line of Zebrafish
- Authors
- Pichler, P., Lagnado, L.
- Source
- Full text @ Curr. Biol.
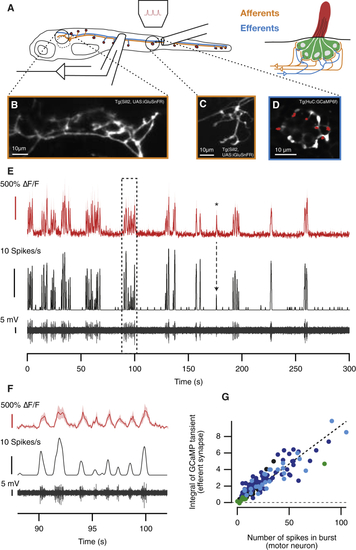
The Efferent Signal Is an Almost Exact Copy of the Motor Signal during Fictive Swimming (A) At 7 dpf, the posterior lateral line of larval zebrafish consists of 14 neuromasts on each side (red dots). Each neuromast is innervated by at least two afferent neurons (yellow) and a single cholinergic efferent (blue). The hair bundles of all hair cells are confined by a gelatinous structure called cupula (red in right panel). We imaged glutamate release of individual hair cells in a neuromast while measuring motor neuron activity through a suction pipette. A second pipette applied pressure steps to the neuromast. (B and C) Average projections of the afferent synapses in the hindbrain (B) and a neuromast (C) of a larva expressing iGluSnFR under transcriptional control of the Sill promoter ( (D) Average projection of a neuromast in a larva expressing GCaMP6f under the transcriptional control of the HuC (elavl3) promoter ( (E) Top trace (red): “spontaneous” calcium transients in efferent synapses observed in the absence of mechanical stimulation (from D) over a 5-min period. The lower traces (black) depict the raw motor activity and the spike rate. The asterisk indicates a signal in the efferent synapses that correlates to six spikes in the motor nerve. (F) Magnified view of the dashed area in (E), showing that efferent synapses in the neuromast are activated at each swim bout. (G) The number of spikes per swimming bout and the integral of the fluorescent signal during that episode were strongly correlated (r = 0.9; n = 155 bouts from 4 neuromasts, each depicted in a different color). See also |
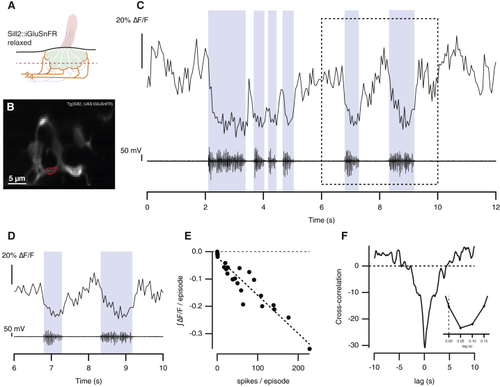
Spontaneous Release of Glutamate from Hair Cells Is Suppressed during Fictive Swimming (A) Experiments were carried out in “relaxed” mutants that express the glutamate reporter iGluSnFR in afferent neurons ( (B) A representative hair cell synapse outlined in red. (C) Spontaneous glutamate release from the synapse in (B) (top) and motor neuron activity measured simultaneously (bottom). Blue areas indicate bursts of fictive swimming. (D) Magnified view of boxed area in (C). The maximum suppression of glutamate release was similar for each burst of motor activity. (E) Relationship between the number of spikes in a burst and the negative integral of the iGluSnFR signal from the neuromast depicted in (B) (n = 28 swimming episodes; r = −0.95). (F) Cross-correlation of iGlusnFR signal and the spike train in the motor nerve (down sampled to match imaging frequency). The inset shows that the maximum degree of anti-correlation occurred at a delay of 50 ms, indicating that the iGluSnFR signal fell within one frame interval of a spike in the motor nerve. See also |
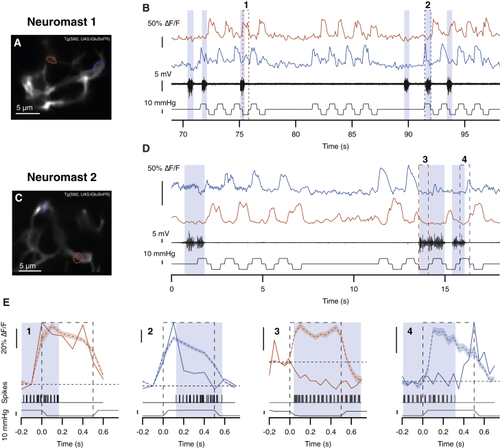
Motor Behavior Blocks Synaptic Transmission from a Subset of Hair Cells Experiments were carried out in relaxed mutants that express the glutamate reporter iGluSnFR in afferent neurons ( (A and B) Image of iGluSnFR expression in afferents of neuromast 1 (A). Two representative synaptic inputs are highlighted in red (activated by anterior deflection) and blue (activated by posterior deflection). The responses of these synapses to mechanical stimuli are shown in (B), together with motor nerve activity (black traces) and pressure steps applied to the neuromast. Positive pressure steps correspond to posterior deflections of the cupula and negative steps to anterior deflections. Blue shading indicates periods of motor nerve activity, and numbered boxes indicate the stimulation episodes that are magnified in (E). (C and D) A corresponding representation of hair cell activity in neuromast 2. (E) Expansion of records in boxes 1–4 in (B) and (D). The superimposed dashed red and blue traces indicate the average mechanically induced response of that synapse in the absence of motor nerve activity. Shaded areas represent the SEM. In example 2, inhibition of glutamate release is almost complete within 50 ms of the beginning of the motor burst. In example 3, suppression is complete within 50 ms, and further motor activity reduces glutamate release below resting levels. In example 4, glutamate release begins to recover within 50 ms of the end of the motor burst. See also |
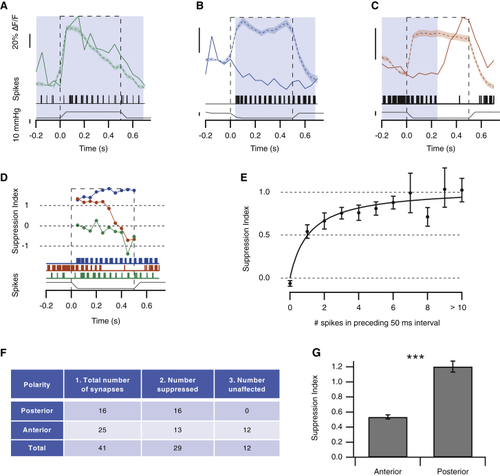
Motor Behavior Selectively Modulates Hair Cells Activated by Deflection in the Posterior Direction (A–C) Three examples of synapses whose response was (A) unaffected, (B) suppressed during the entire stimulation episode, and (C) suppressed only during the initial part of the stimulus (shaded areas represent the SEM). (D) The suppression index (SI), calculated on a point-by-point basis during mechanical stimulation ( (E) Plot of the relation between the SI at each time point during a mechanical stimulus and the number of spikes in the motor nerve in the preceding 50-ms time interval. Only synapses classified as suppressed were analyzed. Collected results from 29 synapses in 6 fish are shown. The data could be described by a Hill equation of the form SI(Ns) = (SImax∗Ns)/(Ns + N1/2), where Ns is the number of spikes, SImax is the maximum SI (1.05 ± 0.08), and N1/2 is the number of spikes coinciding with half-maximal suppression (1.12 ± 0.42). Error bars show SEM. (F) The effects of motor activity on synaptic transmission from hair cells of opposing polarity. Column 1: the number of synapses activated by deflection in the posterior and anterior directions is shown. Measurements were made in a total of 41 synapses in 8 neuromasts in 6 fish. Column 2: the number of synapses suppressed during motor activity, classified as described in the (G) Comparison of the average magnitude of the suppression index during a swimming bout in hair cells polarized for anterior and posterior deflection. We also compared the maximal SI values during a swimming bout: these were also significantly different in hair cells of opposite polarity (p < 0.001; Mann-Whitney U test). Bars show SEM. |