
Figure 1
- ID
- ZDB-FIG-200112-23
- Publication
- Pichler et al., 2019 - Motor Behavior Selectively Inhibits Hair Cells Activated by Forward Motion in the Lateral Line of Zebrafish
- Other Figures
- All Figure Page
- Back to All Figure Page
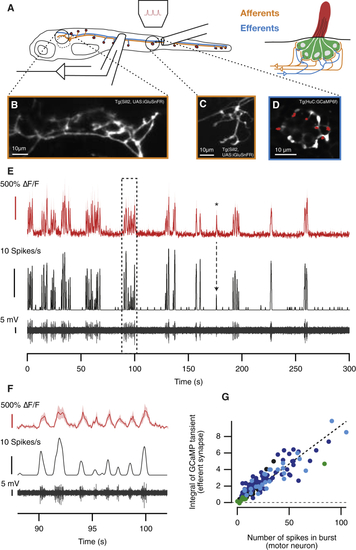
The Efferent Signal Is an Almost Exact Copy of the Motor Signal during Fictive Swimming (A) At 7 dpf, the posterior lateral line of larval zebrafish consists of 14 neuromasts on each side (red dots). Each neuromast is innervated by at least two afferent neurons (yellow) and a single cholinergic efferent (blue). The hair bundles of all hair cells are confined by a gelatinous structure called cupula (red in right panel). We imaged glutamate release of individual hair cells in a neuromast while measuring motor neuron activity through a suction pipette. A second pipette applied pressure steps to the neuromast. (B and C) Average projections of the afferent synapses in the hindbrain (B) and a neuromast (C) of a larva expressing iGluSnFR under transcriptional control of the Sill promoter ( (D) Average projection of a neuromast in a larva expressing GCaMP6f under the transcriptional control of the HuC (elavl3) promoter ( (E) Top trace (red): “spontaneous” calcium transients in efferent synapses observed in the absence of mechanical stimulation (from D) over a 5-min period. The lower traces (black) depict the raw motor activity and the spike rate. The asterisk indicates a signal in the efferent synapses that correlates to six spikes in the motor nerve. (F) Magnified view of the dashed area in (E), showing that efferent synapses in the neuromast are activated at each swim bout. (G) The number of spikes per swimming bout and the integral of the fluorescent signal during that episode were strongly correlated (r = 0.9; n = 155 bouts from 4 neuromasts, each depicted in a different color). See also |