
- Title
-
Combinatorial action of NF-Y and TALE at embryonic enhancers defines distinct gene expression programs during zygotic genome activation in zebrafish
- Authors
- Stanney, W., Ladam, F., Donaldson, I.J., Parsons, T.J., Maehr, R., Bobola, N., Sagerström, C.G.
- Source
- Full text @ Dev. Biol.
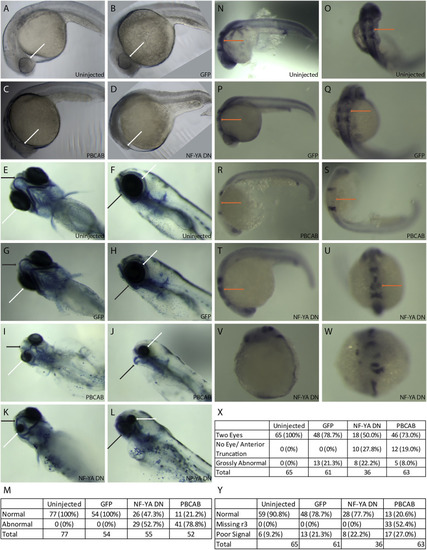
Disruption of NF–Y or TALE function affects anterior embryonic development. Zebrafish embryos were left uninjected (A, E, F, N, O) or injected with either control mRNA (GFP; B, G, H, P, Q), mRNA encoding a TALE dominant negative construct (PBCAB; C, I, J, R, S) or mRNA encoding an NF–Y dominant negative construct (NF-YA DN; D, K, L, T-W) at the 1–2 cell stage and raised to 24hpf (N–W), 28hpf (A–D) or 5dpf (E–L). Embryos were either left untreated (A–D), stained with alcian blue (E–L) or processed for detection of pax2 (at the mid/hindbrain boundary), krox20 (in rhombomeres 3 and 5) and hoxd4 (in the spinal cord) transcripts by in situ hybridization (N–W). White arrows highlight differences in eye morphology (A–L), black arrows highlight differences in head cartilage formation (E–L) and orange arrows indicate differences in rhombomere 3 krox20 expression (N–U). Tables summarize effects of TALE or NF–Y disruption on head cartilage formation (M), eye formation (X) and gene expression (Y). Panels V and W show representative images of embryos scored as having gross abnormalities in panel X. Embryos are shown in lateral (A-D, F, H, J, L, N, P, R, T, V) or dorsal (E, G, I, K, O, Q, S, U, W) views. |
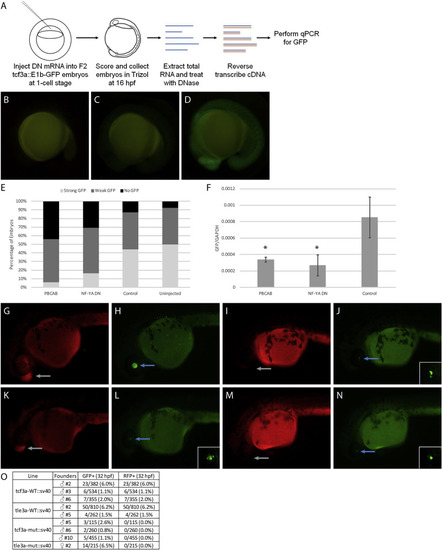
Disruption of TALE and NF–Y function reduces enhancer activity. (A) Schematic showing workflow for dominant negative disruption of tcf3a:E1b-GFP. (B–D) Representative images showing no GFP (B), weak GFP (C), and strong GFP (D) of dominant negative-injected embryos. (E) Distribution of GFP expression in uninjected embryos and embryos injected with PBCAB, NF-YA DN or control RNA. (F) RT-qPCR-based detection of GFP expression in embryos injected with PBCAB, NF-YA DN or control RNA. Data are shown as mean±SEM. Statistical test: unpaired t-test. (G–N) Representative examples of RFP (G, K, I, M) and GFP (H, L, J, N) signal in tcf3a-WT:sv40 (G, H), tcf3a-mut:sv40 (I, J), tle3a-WT:sv40 (K, L) and tle3a-mut:sv40 (M, N) embryos at 32hpf. Insets in panels L, J, N show higher magnification of GFP expression in lens. Note that embryo in panels G, H is at a later stage than embryos in panels I–N. (O) Table quantifying results from experiment in panels G–N. |
Reprinted from Developmental Biology, 459(2), Stanney, W., Ladam, F., Donaldson, I.J., Parsons, T.J., Maehr, R., Bobola, N., Sagerström, C.G., Combinatorial action of NF-Y and TALE at embryonic enhancers defines distinct gene expression programs during zygotic genome activation in zebrafish, 161-180, Copyright (2019) with permission from Elsevier. Full text @ Dev. Biol.