
|
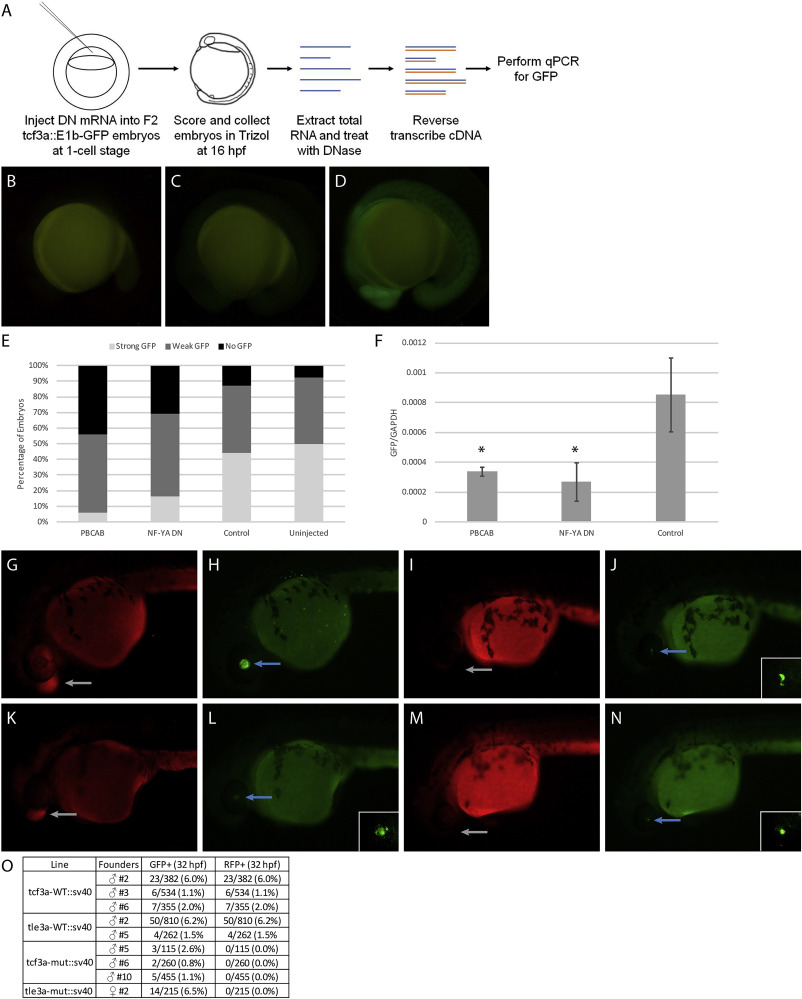
Fig. 9 Disruption of TALE and NF–Y function reduces enhancer activity. (A) Schematic showing workflow for dominant negative disruption of tcf3a:E1b-GFP. (B–D) Representative images showing no GFP (B), weak GFP (C), and strong GFP (D) of dominant negative-injected embryos. (E) Distribution of GFP expression in uninjected embryos and embryos injected with PBCAB, NF-YA DN or control RNA. (F) RT-qPCR-based detection of GFP expression in embryos injected with PBCAB, NF-YA DN or control RNA. Data are shown as mean±SEM. Statistical test: unpaired t-test. (G–N) Representative examples of RFP (G, K, I, M) and GFP (H, L, J, N) signal in tcf3a-WT:sv40 (G, H), tcf3a-mut:sv40 (I, J), tle3a-WT:sv40 (K, L) and tle3a-mut:sv40 (M, N) embryos at 32hpf. Insets in panels L, J, N show higher magnification of GFP expression in lens. Note that embryo in panels G, H is at a later stage than embryos in panels I–N. (O) Table quantifying results from experiment in panels G–N.
Reprinted from Developmental Biology, 459(2), Stanney, W., Ladam, F., Donaldson, I.J., Parsons, T.J., Maehr, R., Bobola, N., Sagerström, C.G., Combinatorial action of NF-Y and TALE at embryonic enhancers defines distinct gene expression programs during zygotic genome activation in zebrafish, 161-180, Copyright (2019) with permission from Elsevier. Full text @ Dev. Biol.