
- Title
-
A primal role for the vestibular sense in the development of coordinated locomotion
- Authors
- Ehrlich, D.E., Schoppik, D.
- Source
- Full text @ Elife
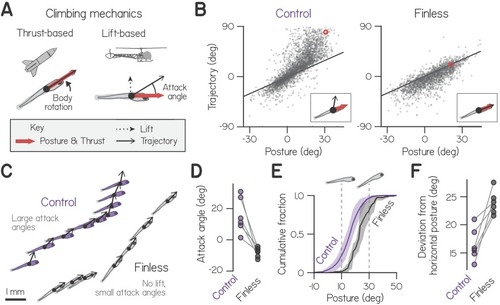
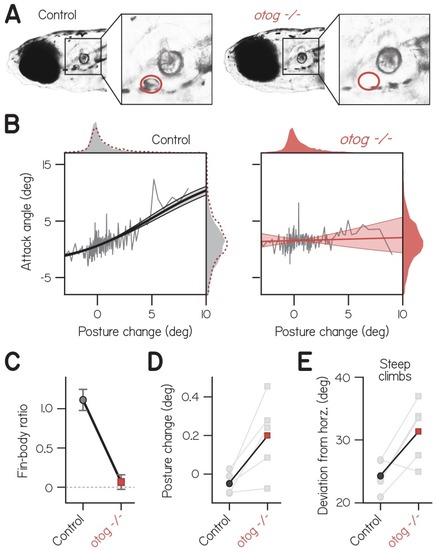
(A) Schematic of hydrostatic climbing mechanics. Like a rocket, a larva generates thrust in the direction it points (top), enabling it to generate upwards trajectories by rotating upwards to adopt nose-up postures. Complementarily, it may generate lift like a helicopter (bottom), creating an attack angle between trajectory and posture. (B) Trajectory of individual swim bouts as a function of posture, for control (2912 bouts) and finless larvae (1890 bouts). The unity line corresponds to 0 attack angle. Example postures and corresponding trajectories (inset) are indicated with red circles. (C) Representative epochs of climbing by one control and one finless larva, depicting posture and trajectory at the times of sequential bouts. Relative positions are to scale, but the body schematic is smaller than actual size to better highlight the trajectory. (D) Mean attack angles for control and finless siblings from six clutches (pairwise t-test, t5=4.55, p=0.0061). (E) Cumulative fractions of postures during climbs with trajectories greater than 20°, for control and finless siblings, plotted as mean ± S.D. across clutches. (F) Absolute deviation of posture from horizontal during climbs in (D) for control and finless siblings (t5=5.02, p=0.0040). |
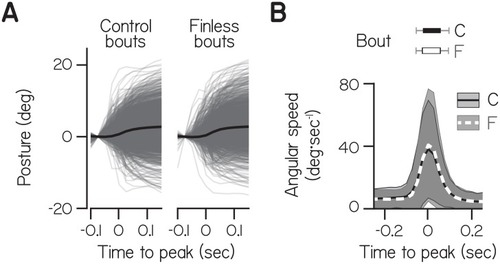
Data from individual bouts (gray lines) and their mean (black) were aligned to peak speed at time 0 and baseline subtracted at −0.75 s. ( |
( |
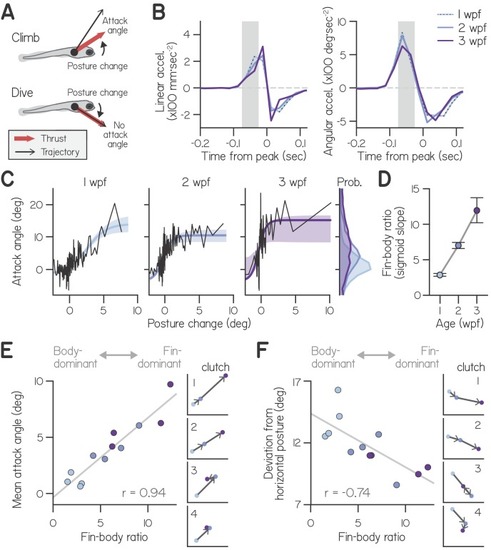
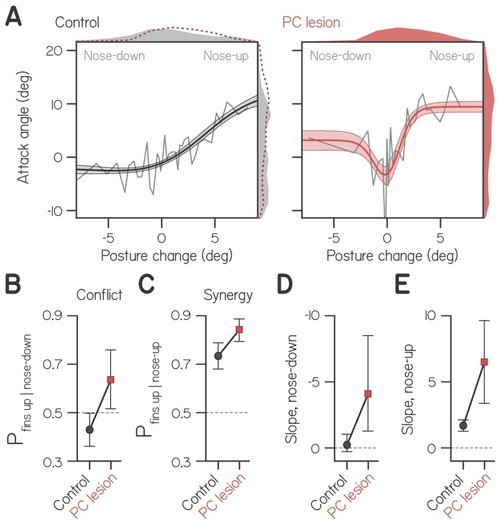
(A) Schematic of fin-body coordination for climbing. Positive posture changes are paired with positive attack angles and negative body rotations with no attack angle, reflecting exclusion of the fins. (B) Mean linear and angular acceleration during swim bouts at 1, 2, and 3 weeks post-fertilization (wpf), temporally aligned to peak linear speed (time 0). The window used to compute posture change is highlighted in gray. (C) Attack angle as a function of posture change for bouts at 1, 2, and 3 wpf, with cropped attack angle probability distributions (right). Data plotted as means of equally sized bins (black lines) and superimposed with best-fit sigmoids and their bootstrapped S.D. (D) Fin-body ratio, defined as the maximal slope of best-fit sigmoid to attack angle and posture change, is plotted with 95% confidence intervals as a function of age. (E,F) Mean attack angle (E) and absolute deviation from horizontal (F) for each clutch and age, evaluated over 48 hr, are plotted as functions of fin-body ratio with Pearson’s correlation coefficients (r; p=5.6E-6 for attack angle and p=6.3E-3 for deviation from horizontal). Small values convey body-dominant synergies, while large values convey fin-dominant synergies. Developmental trajectories for the four individual clutches are plotted on identical axes (right). |
( |
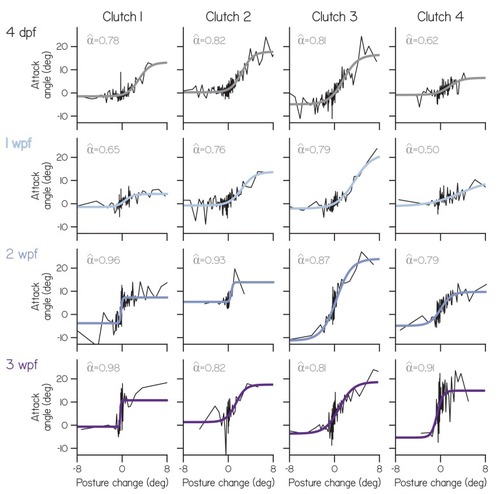
Attack angle as a function of posture change for individual clutches (columns) at each age (rows), plotted as means of equally-sized bins, superimposed with four parameter sigmoid fits. Empirical fin bias ( |
( |
( |