
Image
|
Figure Caption
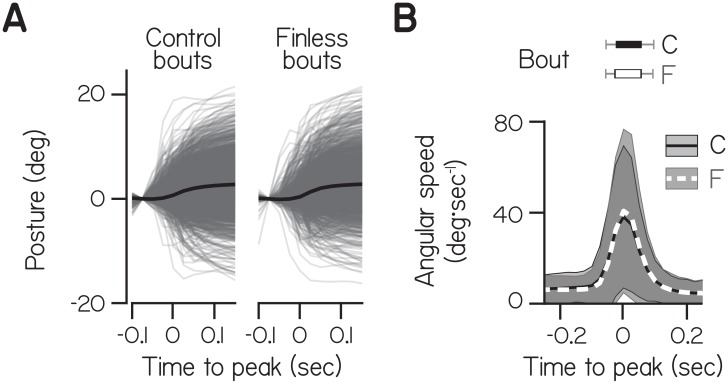
Figure 1— supplement 2.
Data from individual bouts (gray lines) and their mean (black) were aligned to peak speed at time 0 and baseline subtracted at −0.75 s. (
Acknowledgments
This image is the copyrighted work of the attributed author or publisher, and
ZFIN has permission only to display this image to its users.
Additional permissions should be obtained from the applicable author or publisher of the image.
Full text @ Elife