
|
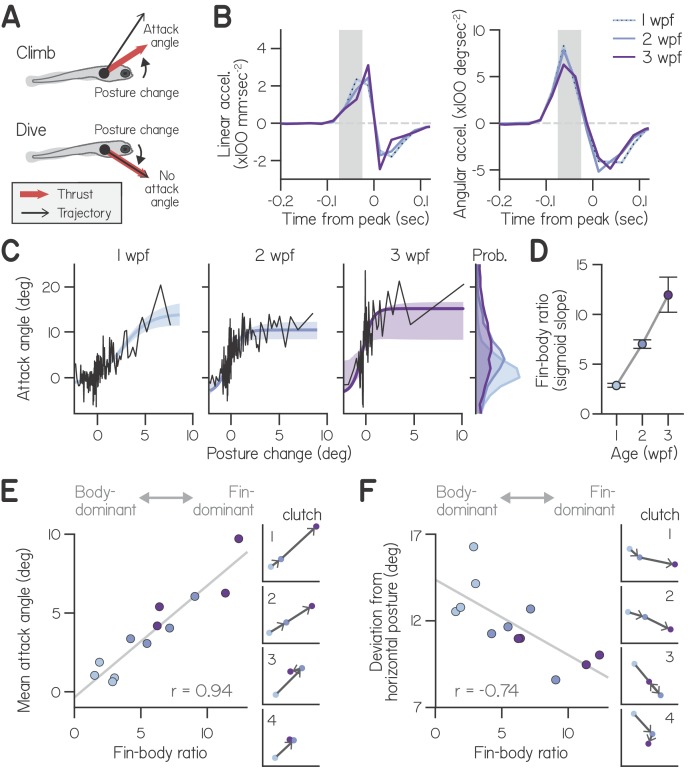
Figure 2 (A) Schematic of fin-body coordination for climbing. Positive posture changes are paired with positive attack angles and negative body rotations with no attack angle, reflecting exclusion of the fins. (B) Mean linear and angular acceleration during swim bouts at 1, 2, and 3 weeks post-fertilization (wpf), temporally aligned to peak linear speed (time 0). The window used to compute posture change is highlighted in gray. (C) Attack angle as a function of posture change for bouts at 1, 2, and 3 wpf, with cropped attack angle probability distributions (right). Data plotted as means of equally sized bins (black lines) and superimposed with best-fit sigmoids and their bootstrapped S.D. (D) Fin-body ratio, defined as the maximal slope of best-fit sigmoid to attack angle and posture change, is plotted with 95% confidence intervals as a function of age. (E,F) Mean attack angle (E) and absolute deviation from horizontal (F) for each clutch and age, evaluated over 48 hr, are plotted as functions of fin-body ratio with Pearson’s correlation coefficients (r; p=5.6E-6 for attack angle and p=6.3E-3 for deviation from horizontal). Small values convey body-dominant synergies, while large values convey fin-dominant synergies. Developmental trajectories for the four individual clutches are plotted on identical axes (right).