FIGURE SUMMARY
Title

Cancer-associated fibroblast-derived Gremlin 1 promotes breast cancer progression

Authors
Ren, J., Smid, M., Iaria, J., Salvatori, D.C.F., van Dam, H., Zhu, H.J., Martens, J.W.M., Ten Dijke, P.
Source
Full text @ Breast Cancer Res.

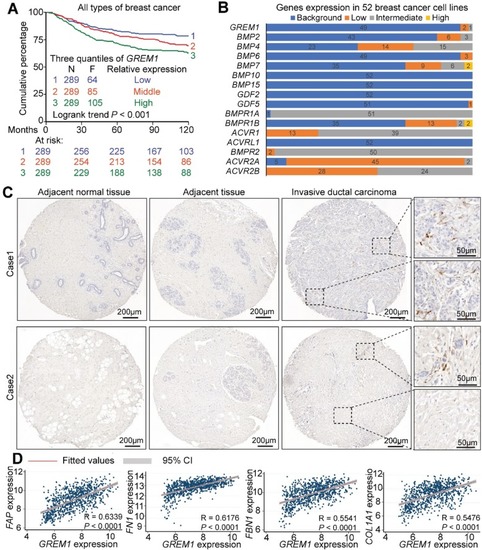
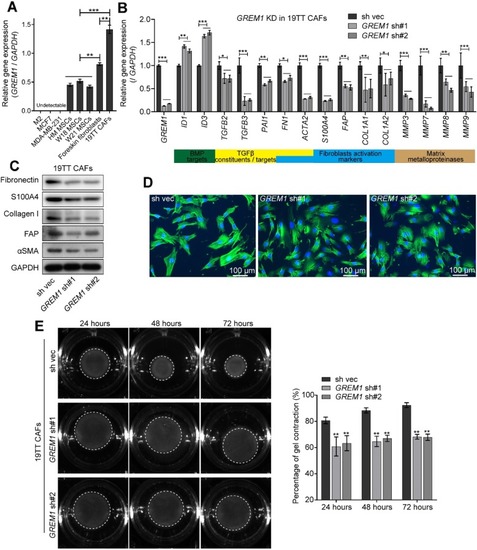
Stromal expression of GREM1 predicts poor clinical outcome in breast cancer. a Kaplan-Meier survival curve in untreated lymph node-negative breast cancer patients. Based on GREM1 mRNA expression (low, middle, and high), the subjects (N = 867) were divided into three quantiles. The endpoint is distant metastasis-free survival. bGREM1, BMP, and BMP receptor mRNA expression level in 52 breast cancer cell lines. The expression levels were categorized to four groups: background, low, intermediated, and high. c Human GREM1 in situ hybridization shows restricted GREM1 expression in fibroblast-like stromal cells surrounded by malignant breast epithelial cells. d Scatterplot showing positive correlation between the expression of GREM1 and stromal genes/desmoplastic markers FAP, FN1, FBN1, and COL1A1 in the clinical datasets. Pearson’s coefficient tests were performed to assess the statistical significance

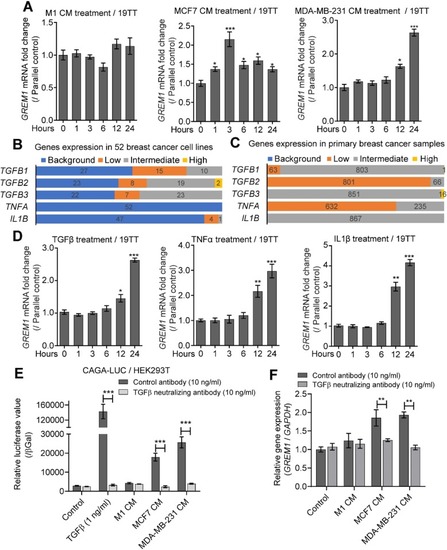
TGFβ secreted by breast cancer cells and inflammatory cytokines induce GREM1 expression in CAFs. aGREM1 expression in 19TT CAFs after treatment with conditioned medium (CM) from breast cell lines (M1, MDA-MB-21, or MCF7). The expression was normalized to the parallel time control of normal medium treatment. The results are expressed as the mean  ± s.d, n = 3. Student’s t test, *P < 0.05, ***P ≤ 0.001. bTGFB1, TGFB2, TGFB3, TNFA, and IL1B mRNA levels in 52 breast cancer cell lines. The expression levels were categorized into four groups: background, low, intermediated, and high. cTGFB1/2/3, TNFA, and IL1B expression in primary breast cancer samples. The expression level was categorized into four groups: background, low, intermediated, and high. d TGFβ3 (5 ng/ml), TNFα (10 ng/ml), or IL1β (10 ng/ml) induce GREM1 expression in 19TT cancer-associated fibroblasts (CAFs). Expression was normalized to the parallel time control of buffer treatment. The results are expressed as the mean  ± s.d., n = 3. Student’s t test, *P < 0.05, **P ≤ 0.01, ***P ≤ 0.001. e Measurements of TGFβ activity in CM from breast cancer cell lines using a CAGA luciferase (LUC) reporter assay in HEK293T cells as a readout. TGFβ-neutralizing antibody (10 ng/ml) was added to demonstrate that luciferase activity in CM is due to the TGFβ activation and not activins or nodal. Recombinant TGFβ was added to control for the functionality of the assay. The value is normalized to β-galactosidase (βGal) activity. The results are expressed as the mean ± s.d, n = 3. Student’s t test, ***P ≤ 0.001. f The induction of GREM1 expression in 19TT CAFs by CM from MCF7 and MDA-MB-21 is blocked by TGFβ-neutralizing antibody. The results are expressed as the mean ± s.d, n = 3. Student’s t test, **P ≤ 0.01

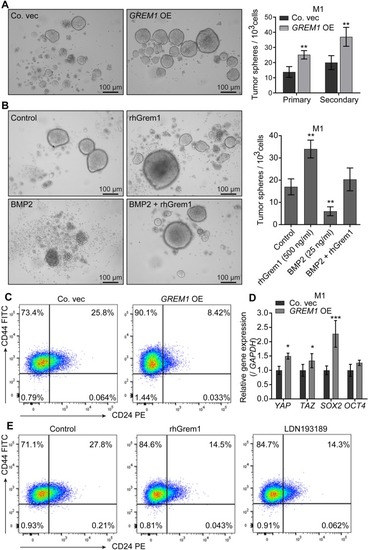
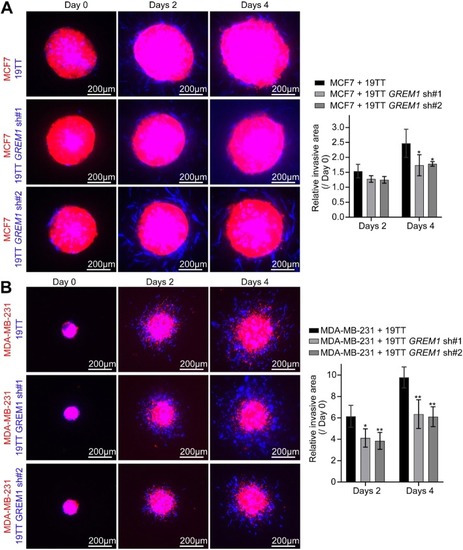
Grem1 maintains stemness in M1 cells. aGREM1 overexpression (OE) induces more mammosphere formation in M1 cells. Left, representative images of mammospheres at 7 days. Right, the number of spheres formed per 1000 cells plated. The primary spheres were disintegrated and replated further. Secondary spheres formed were counted. The results are expressed as the mean ± s.d., n = 3. Student’s t test, **P ≤ 0.01. b Pro-mammosphere formation ability of recombinant human Grem1 (rhGrem1) protein (500 ng/ml) can be neutralized by BMP2 (50 ng/ml). Left, representative images of spheres at 7 days; right, the number of spheres formed per 1000 cells plated. The results are expressed as the mean ± s.d., n = 3. Student’s t test, **P ≤ 0.01. c Flow cytometry analysis shows that GREM1 OE in M1 cells increases the stem population (CD44+/high CD24−/low). dGREM1 OE in M1 cells upregulates stem cell transcription factors. GAPDH was used as an internal control. The results are expressed as the mean ± s.d., n = 3. Student’s t test, *P < 0.05, ***P ≤ 0.001. e Flow cytometry analysis showing that 2 days of treatment with rhGrem1 (500 ng/ml) or the BMP type I receptor inhibitor LDN193198 (120 nM) also leads to an increase in the CD44+/high CD24−/low population

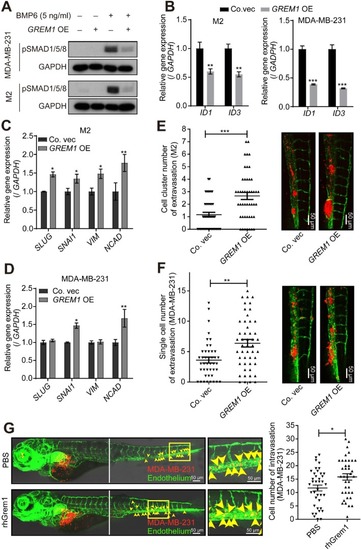
Ectopic expression of
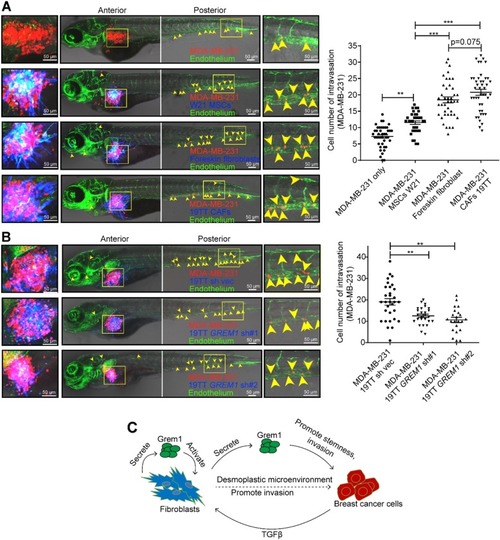
 GREM1 promotes cancer cell invasion in a zebrafish model. a, bGREM1 overexpression (OE) inhibits BMP-induced SMAD1/5/8 phosphorylation (pSMAD1/5/8 (a)) and the BMP target genes ID1 and ID3 (b) in MDA-MB-231 and M2 cell lines. GAPDH was used as an internal control. The results are expressed as the mean ± s.d., n = 3. Student’s t test, **P ≤ 0.01. c, dGREM1 OE upregulates the expression of EMT transcription factors and markers in M2 (c) and MDA-MB-231 (d) cells. GAPDH was used as an internal control. The results are expressed as the mean ± s.d., n = 3. Student’s t test, **P ≤ 0.01. e, fGREM1 OE induces more clusters formation in M2 cells (e) and promotes the invasion of MDA-MB-231 cells (f) in zebrafish. Left, quantification of the number of extravasated cells/clusters at 5 days post-injection (dpi). Right, representative images: green, vasculature of zebrafish; red, mCherry-labeled cells. The results are expressed as the mean ± s.e.m., n = 2. Student’s t test, **P ≤ 0.01, ***P ≤ 0.001. g Perivitelline space injection of MDA-MB-231 cells supplemented with rhGrem1 (1 μg/ml) increases cell intravasation in zebrafish. Left, representative images: green, vasculature of zebrafish; red, mCherry-labeled cells. Right, quantification of the number of intravasated cells in each embryonic body at 3 days post-injection (dpi). The results are expressed as the mean ± s.e.m., n = 2. Student’s t test, *P < 0.05

GREM1 knockdown in 19TT breast cancer-associated fibroblasts (CAFs) attenuates fibrotic characteristics. a qRT-PCR comparison of relative GREM1 expression in M2, MCF7, MDA-MB-231, HM, W18, and W21 fetal mesenchymal stem cells (MSCs), foreskin fibroblasts, and 19TT CAFs. GAPDH was used as an internal control. The results are expressed as the mean ± s.d., n = 3. Student’s t test, **P ≤ 0.01, ***P ≤ 0.001. b qRT-PCR analysis of the selected genes, BMP targets, TGFβ pathway constituents/targets, fibroblast activation markers, and matrix metalloproteinases in 19TT CAFs with/without shRNA-mediated GREM1 knockdown. GAPDH was used as an internal control. The results are expressed as the mean ± s.d., n = 3. Student’s t test, *P ≤ 0.05, **P ≤ 0.01, ***P ≤ 0.001. c Western blot analysis to detect the changes in indicated proteins after GREM1 knockdown in 19TT CAFs. d 19TT CAFs with/without GREM1 knockdown were stained with fluorescein-phalloidin (green) to visualize F-actin. DAPI was used for nuclear staining (blue). e Collagen gel contraction assay. 19TT CAFs with/without GREM1 knockdown were embedded in collagen gels. After 24, 48, and 72 h, the area of each gel (white dash circle) was imaged and quantified. Left, representative images of contracted gels. Right, the percentage of gel contraction. Quantification is shown in the “Methods” section. The results are expressed as the mean  ± s.d., n = 3. Student’s t test, **P ≤ 0.01

GREM1 knockdown in 19TT breast cancer-associated fibroblasts (CAFs) impairs breast cancer cell invasion in a 3D spheroid invasion model. a, b Collagen invasion assay of co-culture spheroids. Eight spheroids per indicated group were embedded into collagen. Left, representative images of 3D spheroid invasion at days 0, 2, and 4. Red, MCF7 (a) or MDA-MB-231 (b) cells; blue, 19TT cells with/without GREM1 knockdown. Right, relative invasion area was quantified as the area difference at days 2 and 4 relative to that at day 0. The results are expressed as the mean  ± s.d., n = 8. Student’s t test, *P < 0.05, **P ≤ 0.01

GREM1 knockdown attenuates the ability of 19TT breast cancer-associated fibroblasts (CAFs) to promote breast cancer cell intravasation in a zebrafish co-injection model. a Perivitelline space single injection of MDA-MB-231 cells or co-injection of MDA-MB-231 cells and W21 mesenchymal stem cells (MSCs), foreskin fibroblasts, or 19TT CAFs, as indicated. The panel shows the representative images. Green, endothelium of zebrafish; red, mCherry-labeled MDA-MB-231; blue, converted from AmCyan-labeled MSCs or fibroblasts. Yellow arrowheads point to the single intravasated cells in the head and tail regions of zebrafish. Left, cell migration in the perivitelline space; middle, the image of a zebrafish embryo body. Right, visualization of the intravasated cells in the posterior of the embryo. The graph shows the quantification of the number of intravasated cells in each embryonic body at 3 days post-injection (dpi). The results are expressed as the mean ± s.e.m., n = 2. Student’s t test, **P ≤ 0.01, ***P ≤ 0.001. b Perivitelline space co-injection of MDA-MB-231 cells and 19TT CAFs with/without GREM1 knockdown. The panel and graph description are the same as described in a. The results are expressed as the mean ± s.e.m., n = 2. Student’s t test, **P ≤ 0.01. c Schematic of the working model of Grem1 function in breast cancer progression. Grem1 expression in fibroblasts is induced by factors (such as TGFβ from breast cancer cells or maybe other stromal cells (that produce inflammatory cytokines). Grem1 could activate fibroblasts into CAFs. CAFs might present a desmoplastic microenvironment, thereby promote cancer cell invasion. Grem1 itself could promote the stemness and invasion of breast cancer cells

Acknowledgments
This image is the copyrighted work of the attributed author or publisher, and ZFIN has permission only to display this image to its users. Additional permissions should be obtained from the applicable author or publisher of the image. Full text @ Breast Cancer Res.