IMAGE

Fig. 4

ID
ZDB-IMAGE-191230-1420
Source
Figures for Ren et al., 2019
Image
Figure Caption

Fig. 4

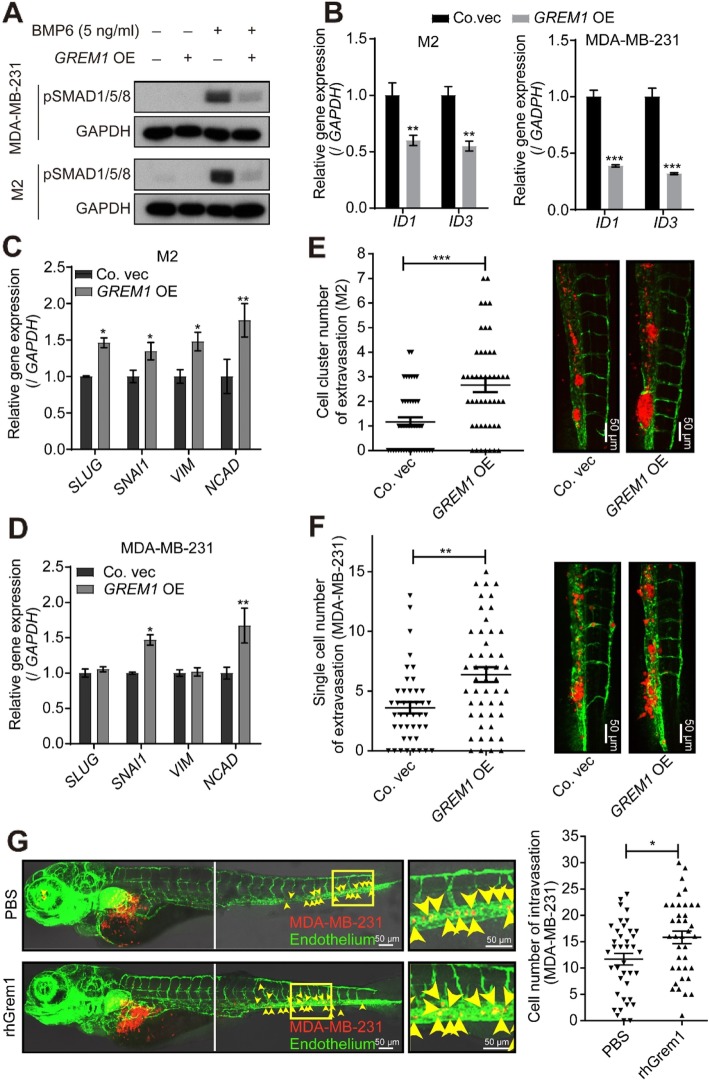
Ectopic expression of GREM1 promotes cancer cell invasion in a zebrafish model. a, bGREM1 overexpression (OE) inhibits BMP-induced SMAD1/5/8 phosphorylation (pSMAD1/5/8 (a)) and the BMP target genes ID1 and ID3 (b) in MDA-MB-231 and M2 cell lines. GAPDH was used as an internal control. The results are expressed as the mean ± s.d., n = 3. Student’s t test, **P ≤ 0.01. c, dGREM1 OE upregulates the expression of EMT transcription factors and markers in M2 (c) and MDA-MB-231 (d) cells. GAPDH was used as an internal control. The results are expressed as the mean ± s.d., n = 3. Student’s t test, **P ≤ 0.01. e, fGREM1 OE induces more clusters formation in M2 cells (e) and promotes the invasion of MDA-MB-231 cells (f) in zebrafish. Left, quantification of the number of extravasated cells/clusters at 5 days post-injection (dpi). Right, representative images: green, vasculature of zebrafish; red, mCherry-labeled cells. The results are expressed as the mean ± s.e.m., n = 2. Student’s t test, **P ≤ 0.01, ***P ≤ 0.001. g Perivitelline space injection of MDA-MB-231 cells supplemented with rhGrem1 (1 μg/ml) increases cell intravasation in zebrafish. Left, representative images: green, vasculature of zebrafish; red, mCherry-labeled cells. Right, quantification of the number of intravasated cells in each embryonic body at 3 days post-injection (dpi). The results are expressed as the mean ± s.e.m., n = 2. Student’s t test, *P < 0.05

Acknowledgments
This image is the copyrighted work of the attributed author or publisher, and ZFIN has permission only to display this image to its users. Additional permissions should be obtained from the applicable author or publisher of the image. Full text @ Breast Cancer Res.