FIGURE SUMMARY
Title

A critical role of VMP1 in lipoprotein secretion

Authors
Morishita, H., Zhao, Y.G., Tamura, N., Nishimura, T., Kanda, Y., Sakamaki, Y., Okazaki, M., Li, D., Mizushima, N.
Source
Full text @ Elife

Loss of vmp1 in zebrafish causes lethality around 9 days post fertilization and defective autophagy. (A) Schematic representation of the Cas9-gRNA-targeted site in the zebrafish vmp1 genomic locus. The protospacer-adjacent motif (PAM) sequence is shown in red. The targeted site is underlined. A 7 bp deletion in the mutated allele is shown. (B) External appearance of 6-dpf vmp1+/+, vmp1+/-, and vmp1-/- zebrafish. Magnified images of the indicated regions are shown in the right panels. Dashed lines indicate abnormal deposits in the liver and intestine. Data are representative of four independent experiments. (C) Survival rate (% of total fish) of vmp1+/+ (n = 7), vmp1+/- (n = 30), and vmp1-/- (n = 11) zebrafish. Data are representative of two independent experiments. (D) Representative images of GFP-LC3 signals in the midbrain, spinal cord, and skeletal muscle of 3-dpf vmp1+/- and vmp1-/- zebrafish injected with GFP-LC3 mRNA. Data are representative of two independent experiments. Scale bars, 10 μm and 1 μm in the inset. (E) Immunoblotting of LC3 and β-actin in two 7-dpf vmp1+/- and vmp1-/- zebrafish. Data are representative of two independent experiments.

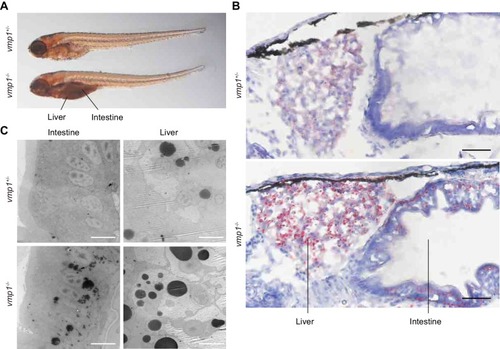
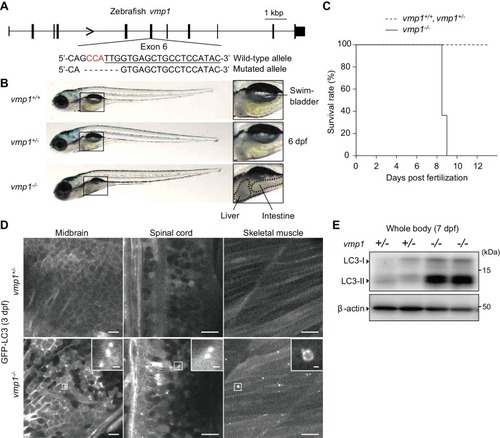
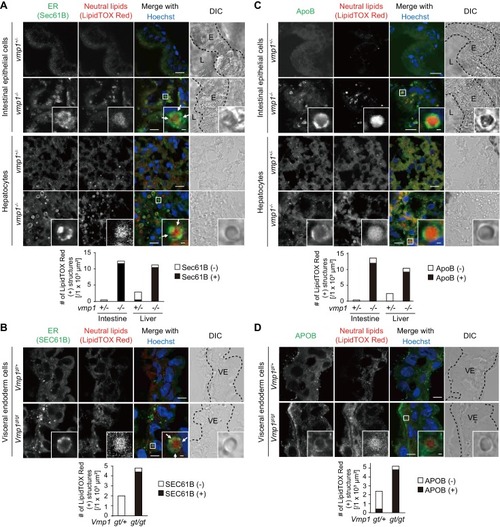
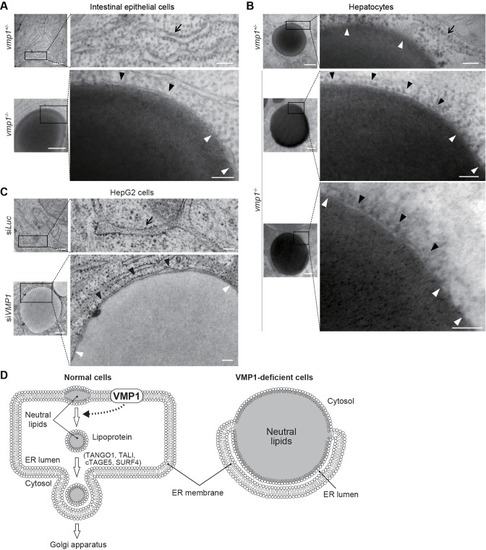
Loss of vmp1 in zebrafish causes accumulation of neutral lipids in the intestine and liver. (A) Oil red O and hematoxylin staining of 6-dpf vmp1+/- and vmp1-/- zebrafish. Data are representative of two independent experiments. Scale bars, 100 μm. (B) and (C) Transmission electron microscopy of the hindbrain (B) and skeletal muscle (C) from 6-dpf vmp1+/- and vmp1-/- zebrafish. Data are representative of two independent experiments. Scale bars, 1 μm. (D) and (E) Transmission electron microscopy of the intestine from 6-dpf rb1cc1+/-, rb1cc1-/- (D), atg5+/- and atg5-/- (E) zebrafish. L, lumen of the intestine. Data are representative of two independent experiments. Scale bars, 5 μm.

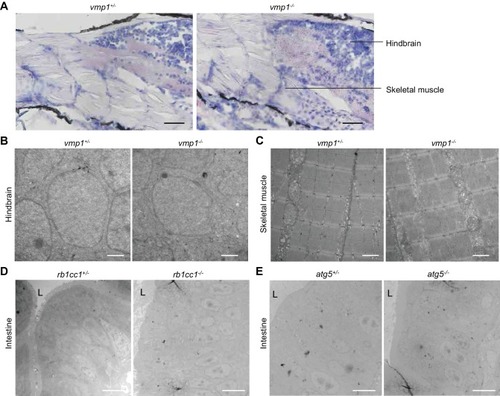
Large lipid-containing structures are not observed in the brain and skeletal muscle of vmp1-/- zebrafish or in the intestine of rb1cc1-/- and atg5-/- zebrafish.

(A) Oil red O and hematoxylin staining of 6-dpf vmp1+/- and vmp1-/- zebrafish. Data are representative of two independent experiments. Scale bars, 100 μm. (B) and (C) Transmission electron microscopy of the hindbrain (B) and skeletal muscle (C) from 6-dpf vmp1+/- and vmp1-/- zebrafish. Data are representative of two independent experiments. Scale bars, 1 μm. (D) and (E) Transmission electron microscopy of the intestine from 6-dpf rb1cc1+/-, rb1cc1-/- (D), atg5+/- and atg5-/- (E) zebrafish. L, lumen of the intestine. Data are representative of two independent experiments. Scale bars, 5 μm.

Genetic map of the gene-trap and floxed alleles of the mouse <italic>Vmp1</italic> gene in <italic>Vmp1<sup>gt</sup></italic> mice and <italic>Vmp1<sup>flox</sup></italic> mice, respectively.

(A) Genomic map of the wild-type and gene-trap (gt) alleles of the mouse Vmp1 gene. Black boxes indicate exons 2 to 5 and the lacZ and neo cassettes. Three loxP sites (triangles) and three primers (F1, F2, and R) used for genotyping are shown. SA, splice acceptor site. pA, poly A signal. (B) Genomic map of the wild-type, floxed, and recombined alleles of the mouse Vmp1 gene. Black boxes indicate exons 2 to 5 and neo cassettes. Triangles indicate loxP sites.

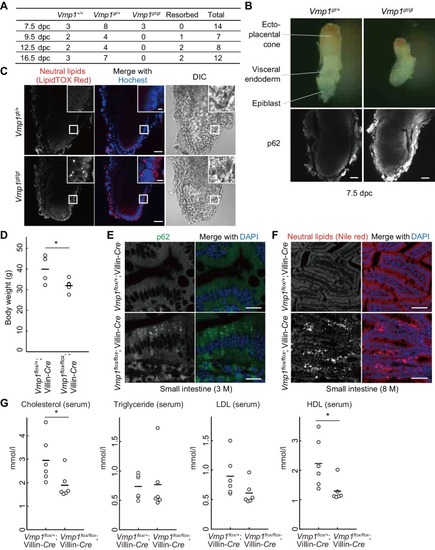
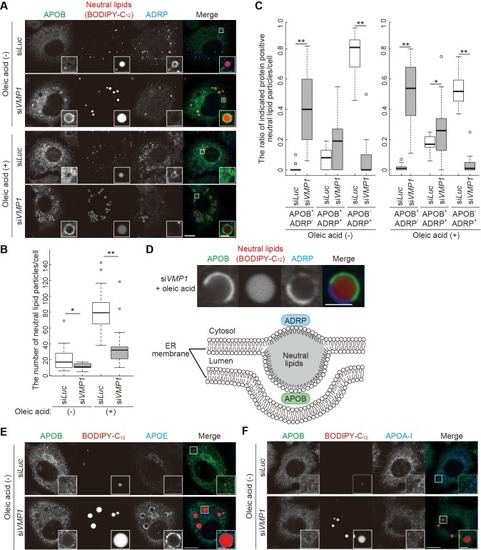
VMP1 is required for secretion and homeostasis of lipoproteins but not for formation of cartilage structures in the zebrafish head skeleton.

(A and B) HepG2 cells were treated with siRNA against luciferase (Luc) or VMP1 and cultured in 0.1% bovine serum albumin (BSA) containing media with or without 200 μM oleic acid for 2 days. Triglycerides- (A) and cholesterols-containing lipoproteins (B) in medium were fractionated by chromatography and analyzed. CM, chylomicron; VLDL, very-low-density lipoprotein; LDL, low-density lipoprotein; HDL, high-density lipoprotein. Data represent the mean ± standard error of the mean (n = 3). (C) HepG2 cells were treated as in (A) and cultured in serum-free medium containing 200 nM oleic acid in the presence or absence of 5 μM lactacystin for 24 hr. The medium was concentrated by TCA precipitation. Samples (approximately 7% or 14% vol of total precipitated media or cell lysates, respectively) were subjected to immunoblot analysis. The amount of APOB was quantified through densitometric scanning of bnd intensities. Data represent the mean ± standard error of the mean (n = 4), which was normalized to siLuc, and statistically analyzed using the Student’s t-test (*, p<0.05).

PHENOTYPE:
Fish:
Observed In:
Stage: Day 6

Vmp1-deficient zebrafish and mice show accumulation of lipoproteins in the intestine, liver, and visceral endoderm. Immunohistochemistry of the intestine and liver from 6-dpf vmp1+/- and vmp1-/- zebrafish (A and C) and the visceral endoderm from 7.5-dpc Vmp1gt/+ and Vmp1gt/gt mice (B and D) using anti-SEC61B antibody (A and B), anti-APOB antibody (C and D), LipidTOX Red, and Hoechst33342. Arrows indicate the regions where the Sec61B/SEC61B signals were weak. The regions of zebrafish intestinal epithelial cells (E), intestinal lumen (L) or mouse visceral endoderm cells (VE) are shown as dashed lines. Data are representative of two independent experiments. Scale bars, 10 μm and 1 μm in the inset. The number of LipidTOX Red (+) structures with (black columns) or without (white columns) SEC61B (A and B) or APOB (C and D) per observed area was analyzed from at least two randomly selected areas using ImageJ software.

Depletion of VMP1 in HepG2 cells does not affect proteasome activity, ER stress, and MTTP expression.

(A) HepG2 cells were treated with siRNA oligonucleotides against luciferase (Luc) or VMP1 and cultured in regular medium in the presence or absence of 5 μM lactacystin for 24 hr. Chymotrypsin-like proteasome activity was measured. Data represent the mean ± standard error of the mean (n = 3) and were statistically analyzed using the Student’s t-test. (B and C) HepG2 cells were treated with siRNA oligonucleotides as in (A) and cultured in regular medium in the presence or absence of 200 nM oleic acid for 24 hr. Cell lysates were analyzed by immunoblotting.

10.7554/eLife.48834.017

Related to <xref rid='fig6s1' ref-type='fig'>Figure 6—figure supplement 1A</xref>.

APOB- and ADRP-double positive structures are not formed by proteasome inhibition, ER stress induction, MTTP inhibition, or depletion of FITM2.

(A) HepG2 cells were treated with 10 μM MG132 or 5 μM lactacystin for 24 hr (without oleic acid), and stained with BODIPY-C12 558/568 for 1 hr. Cells were fixed and stained with anti-APOB and anti-ADRP antibodies. Scale bars, 10 μm and 1 μm in the inset. The ratio of APOB- or ADRP-positive neutral lipid particles was quantified. Solid bars indicate median, boxes the interquartile range (25th to 75th percentile), and whiskers 1.5 times the interquartile range. The outliers are plotted individually. Differences were determined by one-way ANOVA with Dunnett test (n ≥ 39 cells). (B and C) HepG2 cells were treated with 2 ng/ml tunicamycin, 100 nM thapsigargin (B), or 10 μM MTTP inhibitor (CP-346086) (C) for 24 hr, stained with BODIPY-C12 558/568 for 1 hr, fixed, and stained with anti-APOB and anti-ADRP antibodies. Scale bars, 10 μm and 1 μm in the inset. (D) HepG2 cells were treated with siRNA oligonucleotides against luciferase (Luc) or FITM2. The relative expression level of FITM2 was quantified by real-time PCR using ACTB as an internal control. Data represent the mean ± standard error of the mean performed in triplicate. (E) HepG2 cells were treated as in (D), cultured in regular medium in the presence of 200 nM oleic acid for 24 hr, stained with BODIPY-C12 558/568 for 1 hr, fixed, and stained with anti-APOB and anti-ADRP antibodies. Scale bars, 10 μm and 1 μm in the inset. Total pixel area of neutral lipids per cell was quantified using ImageJ software. Solid bars indicate median, boxes the interquartile range (25th to 75th percentile), and whiskers 1.5 times the interquartile range. The outliers are plotted individually. Differences were determined by two-tailed Welch’s t-test (**, p<0.01; n ≥ 35 cells).

10.7554/eLife.48834.019

Related to <xref rid='fig6s2' ref-type='fig'>Figure 6—figure supplement 2A,D,E</xref>.

Neutral lipids accumulate within the ER membrane in the absence of VMP1.

(A–C) Transmission electron microscopy of intestinal epithelial cells (A) and hepatocytes (B) from 6-dpf vmp1+/- and vmp1-/- zebrafish and VMP1-depleted HepG2 cells (C). Black and white arrowheads indicate the presence and absence of a lipid bilayer on neutral lipid-containing structures, respectively. Arrows indicate the ER membrane. Data are representative of three independent experiments. Scale bars, 500 nm and 100 nm in magnified panels. (D) Models for the membrane structure on lipids in the ER in wild-type and VMP1-deficient cells. Black and white arrowheads correspond to those in (A) to (C). In VMP1-deficient cells, the surfaces of neutral lipid structures (monolayer) are continuous to the ER membranes (bilayer), whereas only phospholipid monolayers cover neutral lipid structures in normal cells.

Acknowledgments
This image is the copyrighted work of the attributed author or publisher, and ZFIN has permission only to display this image to its users. Additional permissions should be obtained from the applicable author or publisher of the image. Full text @ Elife