
- Title
-
Epithelial delamination is protective during pharmaceutical-induced enteropathy
- Authors
- Espenschied, S.T., Cronan, M.R., Matty, M.A., Mueller, O., Redinbo, M.R., Tobin, D.M., Rawls, J.F.
- Source
- Full text @ Proc. Natl. Acad. Sci. USA
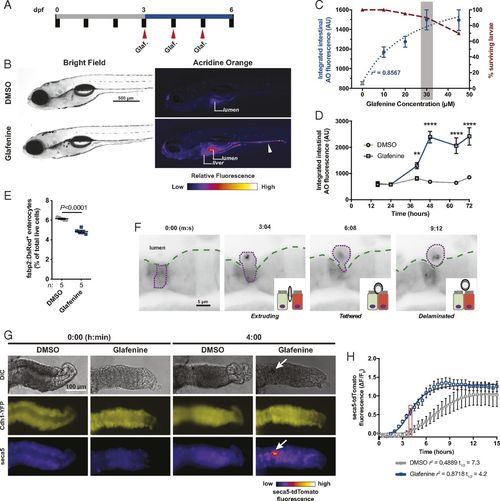
Serial Glafenine exposure results in IEC delamination. (A) Schematic of dosing regimen used for serial Glafenine (Glaf.) exposure. (B) Representative brightfield and AO fluorescence images of 6 dpf DMSO- and Glafenine-treated larvae (arrowhead points to AO+ material in the intestinal lumen). (C) Glafenine dose–response for quantified intestinal AO fluorescence (left y axis, blue, 3-parameter least-squares fit) and survival (right y axis, maroon). (D) Kinetics of intestinal AO response with 30 μM Glafenine (n = 20 larvae per condition per time point; significance was determined between treatment groups within each time point by unpaired 2-sided Student’s t test; **P < 0.01, ****P < 0.0001). (E) Flow cytometry analysis of relative abundance of viable (7-AAD−) Tg(fabp2:DsRed)+ enterocytes from DMSO- and Glafenine-treated larvae (each point is a pool of 20 larvae; significance was determined in by unpaired 2-sided Student’s t test). (F) Sequential frames from live confocal imaging of Tg(fabp2:DsRed) larvae at 40 h into the treatment regimen. (G) Representative images of dissected larval zebrafish intestines exposed to DMSO or Glafenine ex vivo at 0 and 4 h (arrow points to mass of apoptotic cells in the intestinal lumen). (H) Quantification of seca5-tdTomato fluorescence in larval intestinal explants (n = 6 DMSO-treated and 5 Glafenine-treated intestines; 4-parameter least-squares fit; comparison of t1/2: P = 0.0002 [extra sum-of-squares F test]). |
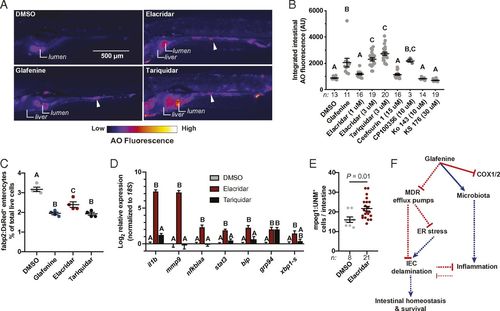
A subset of MDR efflux pump inhibitors phenocopy the effects of Glafenine. (A) Representative fluorescence images of AO-stained larvae from the indicated treatment groups (arrowheads indicate AO+ material in the intestinal lumen). (B) Intestinal AO quantification for larvae treated with DMSO, Glafenine, or the indicated MDR inhibitors (each dot corresponds to an individual larva; significance determined by 1-way ANOVA with Tukey’s multiple comparison test). (C) Relative abundance of fabp2:DsRed+ enterocytes from (n = 4 replicates group, 20 larvae per replicate). (D) qRT-PCR analysis of inflammatory and UPR mRNAs (n = 4 replicates per condition, ≥5,000 cells per replicate). (E) Quantification of intestine associated macrophages (mpeg1+ cells) from DMSO- and Elacridar-treated larvae (each point corresponds to an individual larva; significance determined by unpaired 2-sided Student’s t test). For B, C, and D, significance was determined by 1-way ANOVA with Tukey’s multiple comparisons test; letters indicate groups determined to be statistically different. (F) Proposed model of Glafenine-induced intestinal toxicity (solid lines indicated experimentally confirmed direct interactions, while dashed lines indicate relationships that may be indirect). |
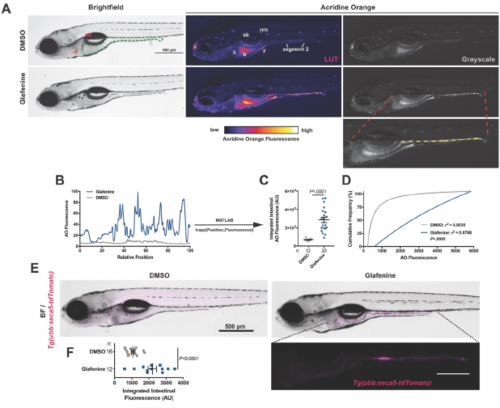
Quantification of Acridine Orange stained lumenal material and response of Tg(ubb:seca5-tdTomato) larvae to Glafenine exposure. (A) Brightfield and fluorescence images (range indicator lookup table and grayscale) of DMSO and Glafenine treated larvae from a representative experiment (li =liver; sb = swim bladder; b = intestinal bulb; y = yolk; nm = neuromast). (B) Representative AO line scan fluorescence traces for larvae shown in (A). (C) Scatter dot plot of integrated intestinal AO from the same experiment in a [the points colored red correspond to the larvae shown in (A)]. Significance determined by unpaired two-sided Student’s t-test. (D) Cumulative frequency distribution plot of data from (C) fit with 3-parameter least squares regression (significance was determined by extra-sum-of-squares F-test, rejecting the null hypothesis that one curve would fit both datasets). (E,F) Images of Tg(ubb:seca5-tdTomato)xt24 DMSO- and Glafenine-treated 6 dpf larvae and quantification (each dot corresponds to an individual larva). Significance was determined by unpaired two-sided Student’s t-test. |
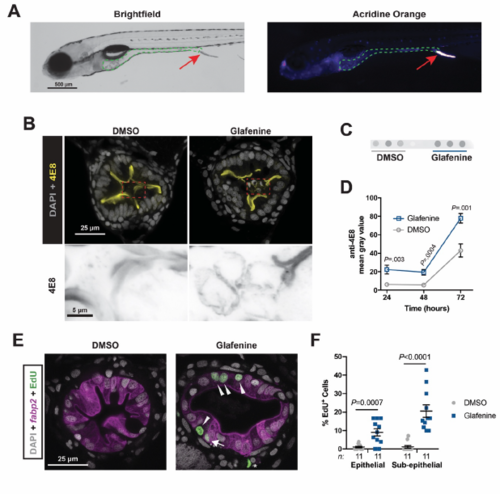
Expelled mass of apoptotic cells contains enterocytes, and Glafenine treated larvae exhibit increased intestinal proliferation. (A) Representative brightfield and AO fluorescence images of a 6 dpf Glafenine-treated zebrafish larva excreting AO+ IEC mass. (B) Representative confocal micrographs of transverse sections immunostained with the IEC brush border antibody 4E8 (merge with DAPI above, inverted 4E8 below). (C,D) Representative media dot blot of one sample pair probed with anti-4E8 and quantification (n = 4 samples / condition / time point, blotted in triplicate). (E,F) Analysis of epithelial proliferation in Tg(fabp2:DsRed) DMSO- and Glafenine-treated larvae (arrow heads mark EdU+ enterocytes, arrow denotes EdU+ sub-epithelial cell, * EdU+ extra-intestinal cell; significance determined by unpaired two-sided Student’s t-test). |
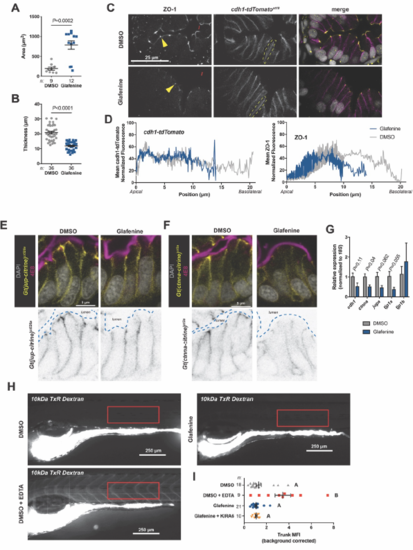
Epithelial junctional organization is overtly normal and barrier function is preserved in Glafenine-treated zebrafish larvae. (A,B) Morphometric analysis of intestinal lumen area and epithelial thickness from transverse sections of 6 dpf larvae. Significance determined by unpaired two-sided Student’s t-test. (C) Confocal micrographs of transverse vibratome sections from DMSO and Glafenine-treated cdh1- tdTomatoxt18 (magenta) larvae stained with anti ZO-1 (yellow) and DAPI (gray). Yellow arrowheads point to apical ZO-1 staining and yellow dashed ovals denote representative basolateral patterning of Cdh1- tdTomato. (D) Representative traces of Cdh1-tdTomato and ZO-1 localization patterns from vibratome sections of larvae treated as indicated. (E,F) Representative confocal images of vibratome sections from 6 dpf DMSO and Glafenine treated Gt(jup-citrine)ct520a and Gt(ctnna-citrine)ct3a larvae (upper panels show merged images including DAPI and the brush border marker 4E8, lower panels show inverted grayscale images of indicated gene trap . lines). (G) qRT-PCR analysis of indicated epithelial junctional components from FACS-isolated fabp2:DsRed+ enterocytes. Significance determined by unpaired two-sided Student’s t-test. (H) Representative images of larvae 30 minutes post gavage with 10 kDa Texas Red dextran (DMSO larvae co-gavaged with EDTA were used as a positive control group for barrier permeability). (I) Quantification of fluorescence in the trunk from larvae treated as indicated (example ROI shown in red boxes in H). Significance determined by one-way ANOVA with Tukey’s multiple comparison’s test; letters indicate groups determined to be statistically different. |
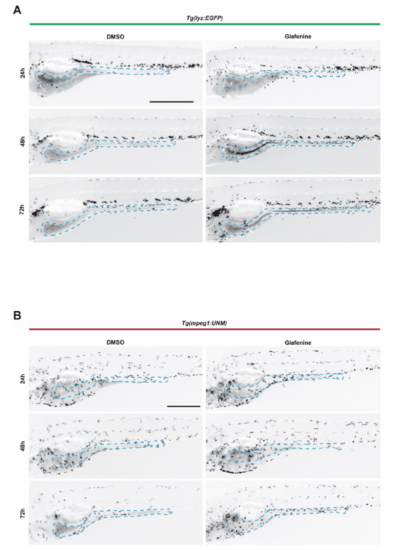
Fluorescent stereomicroscopy of intestine-associated leukocytes. (A,B) Representative 8-bit images of DMSO and Glafenine-treated Tg(lyz:GFP) (A) and Tg(mpeg1:UNM) (B) larvae at the indicated times during the serial exposure regimen (inverted for presentation). The intestine in each image is outlined with a dashed blue line. |