
|
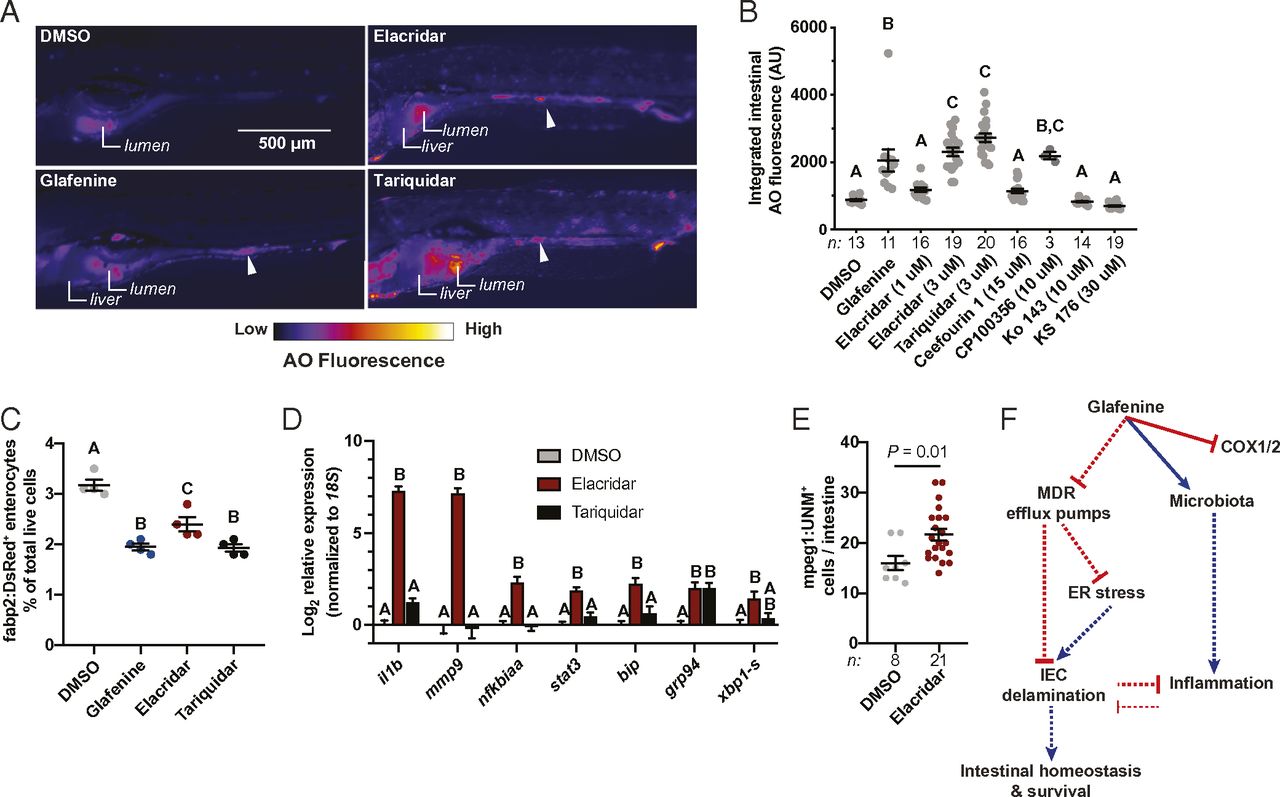
Fig. 5
A subset of MDR efflux pump inhibitors phenocopy the effects of Glafenine. (A) Representative fluorescence images of AO-stained larvae from the indicated treatment groups (arrowheads indicate AO+ material in the intestinal lumen). (B) Intestinal AO quantification for larvae treated with DMSO, Glafenine, or the indicated MDR inhibitors (each dot corresponds to an individual larva; significance determined by 1-way ANOVA with Tukey’s multiple comparison test). (C) Relative abundance of fabp2:DsRed+ enterocytes from (n = 4 replicates group, 20 larvae per replicate). (D) qRT-PCR analysis of inflammatory and UPR mRNAs (n = 4 replicates per condition, ≥5,000 cells per replicate). (E) Quantification of intestine associated macrophages (mpeg1+ cells) from DMSO- and Elacridar-treated larvae (each point corresponds to an individual larva; significance determined by unpaired 2-sided Student’s t test). For B, C, and D, significance was determined by 1-way ANOVA with Tukey’s multiple comparisons test; letters indicate groups determined to be statistically different. (F) Proposed model of Glafenine-induced intestinal toxicity (solid lines indicated experimentally confirmed direct interactions, while dashed lines indicate relationships that may be indirect).