
- Title
-
Comparison of zebrafish larvae and hiPSC cardiomyocytes for predicting drug induced cardiotoxicity in humans
- Authors
- Dyballa, S., Miñana, R., Rubio-Brotons, M., Cornet, C., Pederzani, T., Escaramis, G., Garcia-Serna, R., Mestres, J., Terriente, J.
- Source
- Full text @ Toxicol. Sci.
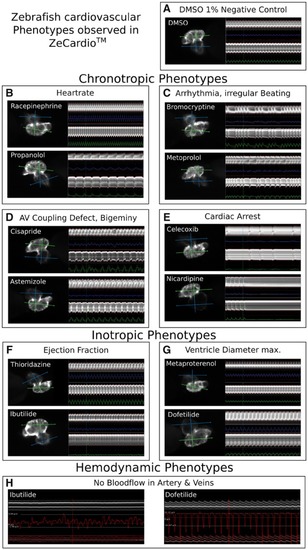
Cardiovascular phenotypes in zebrafish as visualized in ZeCardio. A selection of representative examples of the cardiovascular phenotypes observed in zebrafish larvae is shown. The individual panels show screen-shots of the display of compounds in the ZeCardio software. For comparison of the cardiac phenotypes (B–G) a heart of negative control larva (DMSO 1%) is shown (A). Chronotropic phenotypes include increase (tachycardia, Racepinephrine, B, top) and decrease (bradycardia, Propranolol, B, bottom) of the heart rate, irregular beating of the heart (arrhythmia, Bromocriptine, Metoprolol, C), AV Coupling defects (Cisapride, D, top) and the special case of Bigeminy (Astemizole, D, bottom) and events of cardiac arrest (Celecoxib and Nicardipine, E). Inotropic phenotypes include changes in ejection fraction (increased ejection fraction: Thioridazine, F, top, decreased ejection fraction, Ibutilide, F, bottom) and changes in the size of the ventricle (increase of the maximum ventricle diameter, Metaproterenol, G, top, and decrease of the maximum ventricle diameter, Dofetilide, G, bottom). In each panel of cardiac phenotypes (A–G) the heart is shown on left and the compound is indicated in the upper left corner. The heart selection in ZeCardio is shown: The quasi vertical line is the selection drawn by the user in ZeCardio. The green perpendicular line is the ventricle line and the blue is the atrium line. The kymographs for ventricle and atrium are shown on the right hand side of each heart panel. Note that for simplicity the kymograph of the atrium is always shown on the top and the kymograph of the ventricle always on the bottom, independent of the heart orientation. Below the individual kymographs a colored line indicates the inverse length of the chamber (ventricle in green, atrium in blue) such that peaks of that curve indicate contractions of the chambers. The hemodynamic phenotypes considered here include absence of blood flow in arteries and veins (H). The 2 panels (Ibutilide, left and Dofetilide, right) show the blood flow profile of the same embryos shown in (F, bottom and G, bottom). Only the kymograph of the vein selection is shown. Below the kymograph, its segmentation is shown (red outlines of the kymograph, bottom of the panel) and the velocities of blood cells are displayed as a red graph. Note that the velocities in Dofetilide reflect the rhythmic nature of the heart beat but that there is no net directional flow, ie, blood cells merely move back and forth in the vessel. |

Heatmap of the |

Comparison of positives in humans, zebrafish larvae, and human induced pluripotent stem cell cardiomyocytes (hiPSC-CMs) for compounds of the class ATC-Cardio. The compounds of class ATC-Cardio are listed on the left. Each row corresponds to 1 compound and the colored cells indicate detection of that compound. Columns correspond to the criteria stated on the x-axis. Compounds are classified as positive in humans (human positive, grey) if they are either withdrawn (withdrawn, black) or have been classified positive on the basis of FAERS data. Compounds are classified as positive in zebrafish (zebrafish positive, dark blue) if significant effects have been detected for any of the numerical features (blue) or if the incidence of Boolean features was above threshold (light blue). Compounds are classified as positive in hiPSC-CMs (hiPSC-CM positive, dark purple) if significant effects have been detected for any of the features at any of the time points (T1 5 min, T2 30 min, T3 90 min after compound addition). The columns T1 hiPSC-CM positive, T2 hiPSC-CM positive, and T3 hiPSC-CM positive (purple) indicate whether a compound was detected at this time point and the detection of the single features for the 3 time points are displayed (light shades of purple). The compounds are ordered according to their response in humans from top to bottom. |
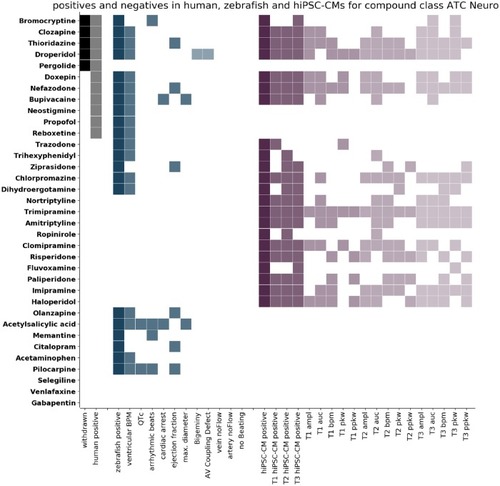
Comparison of positives in humans, zebrafish larvae, and human induced pluripotent stem cell cardiomyocytes (hiPSC-CMs) for compounds of the class ATC-Neuro. The compounds of class ATC-Neuro are listed on the left. Each row corresponds to 1 compound and the colored cells indicate detection of that compound. Columns correspond to the criteria stated on the x-axis. Compounds are classified as positive in humans (human positive, grey) if they are either withdrawn (withdrawn, black) or have been classified positive on the basis of FAERS data. Compounds are classified as positive in zebrafish (zebrafish positive, dark blue) if significant effects have been detected for any of the numerical features (blue), or if the incidence of Boolean features was above threshold (light blue). Compounds are classified as positive in hiPSC-CMs (hiPSC-CM positive, dark purple) if significant effects have been detected for any of the features at any of the time points (T1 5 min, T2 30 min, T3 90 min after compound addition). The columns T1 hiPSC-CM positive, T2 hiPSC-CM positive, and T3 hiPSC-CM positive (purple) indicate whether a compound was detected at this time point and the detection of the single features for the 3 time points are displayed (light shades of purple). The compounds are ordered according to their response in humans from top to bottom. |

Comparison of positives in humans, zebrafish larvae, and human induced pluripotent stem cell cardiomyocytes (hiPSC-CMs) for compounds of the class ATC-Other. The compounds of class ATC-Other (belonging to neither ATC-Cardio nor ATC-Neuro) are listed on the left. Each row corresponds to 1 compound and the colored cells indicate detection of that compound. Columns correspond to the criteria stated on the x-axis. Compounds are classified as positive in humans (human positive, grey) if they are either withdrawn (withdrawn, black) or have been classified positive on the basis of FAERS data. Compounds are classified as positive in zebrafish (zebrafish positive, dark blue) if significant effects have been detected for any of the numerical features (blue) or if the incidence of Boolean features was above threshold (light blue). Compounds are classified as positive in hiPSC-CMs (hiPSC-CM positive, dark purple) if significant effects have been detected for any of the features at any of the time points (T1 5 min, T2 30 min, T3 90 min after compound addition). The columns T1 hiPSC-CM positive, T2 hiPSC-CM positive, and T3 hiPSC-CM positive (purple) indicate whether a compound was detected at this time point and the detection of the single features for the 3 time points are displayed (light shades of purple). The compounds are ordered according to their response in humans from top to bottom. |