
|
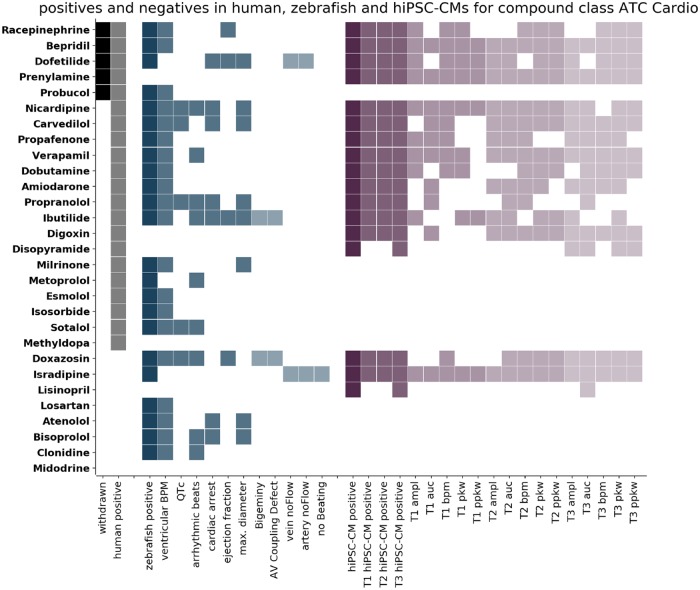
Figure 3.
Comparison of positives in humans, zebrafish larvae, and human induced pluripotent stem cell cardiomyocytes (hiPSC-CMs) for compounds of the class ATC-Cardio. The compounds of class ATC-Cardio are listed on the left. Each row corresponds to 1 compound and the colored cells indicate detection of that compound. Columns correspond to the criteria stated on the x-axis. Compounds are classified as positive in humans (human positive, grey) if they are either withdrawn (withdrawn, black) or have been classified positive on the basis of FAERS data. Compounds are classified as positive in zebrafish (zebrafish positive, dark blue) if significant effects have been detected for any of the numerical features (blue) or if the incidence of Boolean features was above threshold (light blue). Compounds are classified as positive in hiPSC-CMs (hiPSC-CM positive, dark purple) if significant effects have been detected for any of the features at any of the time points (T1 5 min, T2 30 min, T3 90 min after compound addition). The columns T1 hiPSC-CM positive, T2 hiPSC-CM positive, and T3 hiPSC-CM positive (purple) indicate whether a compound was detected at this time point and the detection of the single features for the 3 time points are displayed (light shades of purple). The compounds are ordered according to their response in humans from top to bottom.