
- Title
-
Identification of compounds that rescue otic and myelination defects in the zebrafish adgrg6 (gpr126) mutant
- Authors
- Diamantopoulou, E., Baxendale, S., de la Vega de León, A., Asad, A., Holdsworth, C.J., Abbas, L., Gillet, V.J., Wiggin, G.R., Whitfield, T.T.
- Source
- Full text @ Elife

ZFIN is incorporating published figure images and captions as part of an ongoing project. Figures from some publications have not yet been curated, or are not available for display because of copyright restrictions. |
|
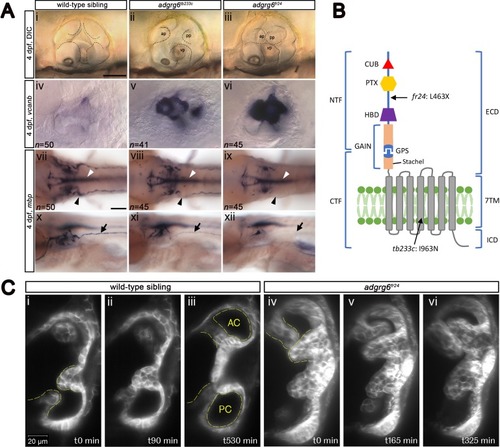
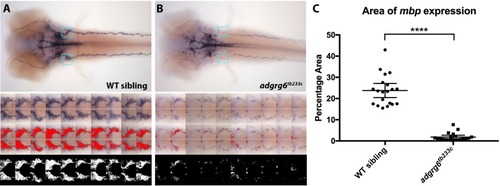
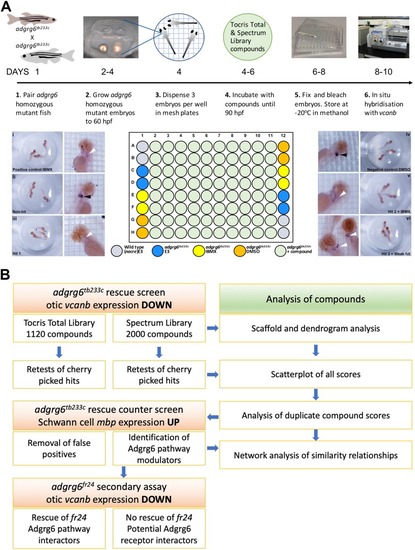
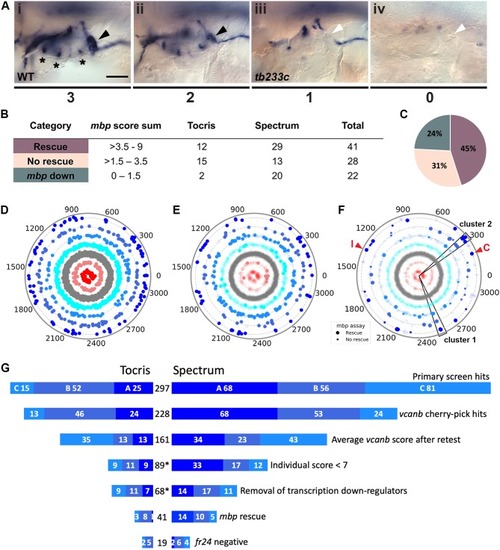
ZFIN is incorporating published figure images and captions as part of an ongoing project. Figures from some publications have not yet been curated, or are not available for display because of copyright restrictions. PHENOTYPE:
|
( |
( |
( |
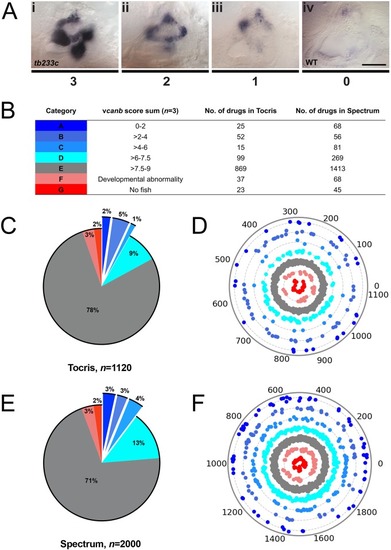
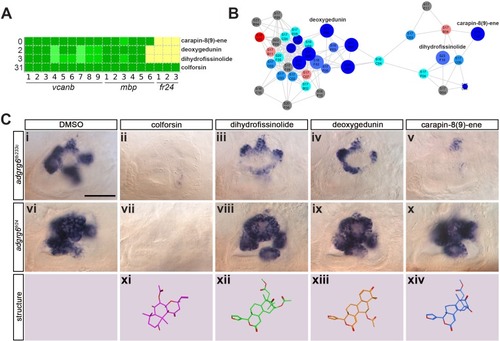
Two different methods were used to remove side chains and determine the core structures of each compound. Scaffolds were then compared and a histogram produced with the number of molecules per scaffold. The histograms on the left use Bemis and Murcko scaffolds ( |
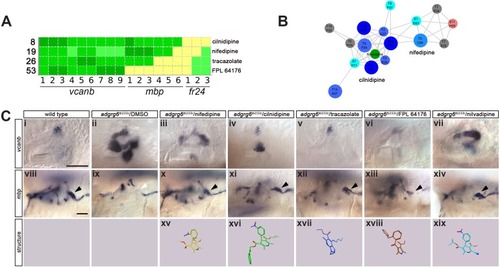
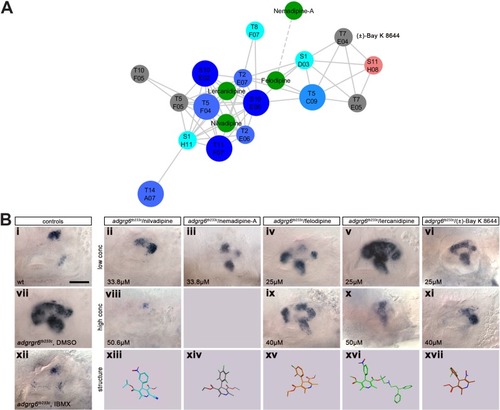
( Dendrogram representing structural similarity between library compounds (Combined). Dendrogram of the combined Spectrum and Tocriscreen Total library compounds based on the similarity matrix between all pairs of compounds. Compounds are named by their plate and well ID. |
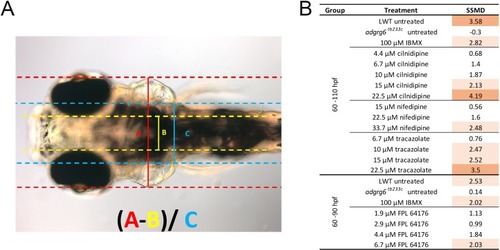
( |
( |
( |
( |
( |