
IMAGE
Figure 3—figure supplement 1.
- ID
- ZDB-IMAGE-190723-994
- Source
- Figures for Diamantopoulou et al., 2019
Image
|
Figure Caption
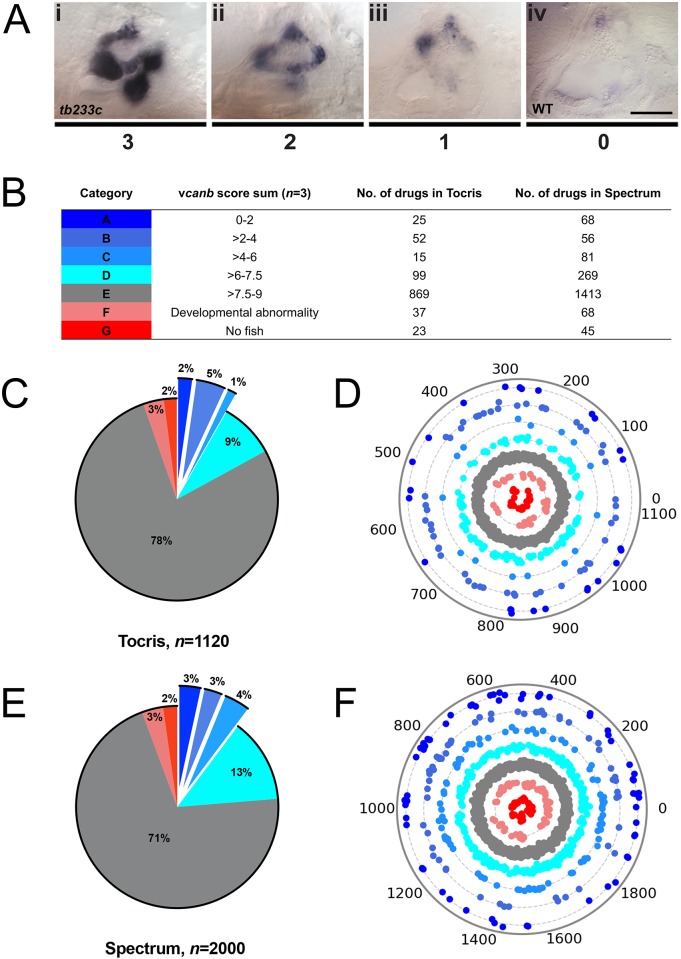
Figure 3—figure supplement 1.
Two different methods were used to remove side chains and determine the core structures of each compound. Scaffolds were then compared and a histogram produced with the number of molecules per scaffold. The histograms on the left use Bemis and Murcko scaffolds (
Acknowledgments
This image is the copyrighted work of the attributed author or publisher, and
ZFIN has permission only to display this image to its users.
Additional permissions should be obtained from the applicable author or publisher of the image.
Full text @ Elife