|
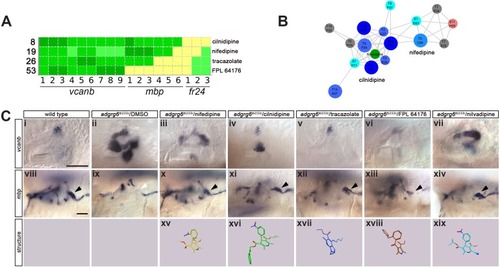
Hit compounds from the <italic>vcanb</italic> screen vary in their ability to restore <italic>mbp</italic> expression in <italic>adgrg6<sup>tb233c</sup></italic> mutant embryos.(A) Section of the heatmap in Figure 5A showing the results for nifedipine, cilnidipine, tracazolate hydrochloride and FPL 64176. (B) Enlargement of the dihydropyridine cluster (cluster 1 in Figures 4G and 5B), highlighting cilnidipine and nifedipine. Compounds that rescued mbp expression are shown as larger nodes, whereas compounds that did not rescue mbp expression are shown as smaller nodes. The relationship of nilvadipine (green circle) to the other compounds in this cluster is also illustrated. (C) (i–vii) Lateral images of the inner ear at 4 dpf stained for vcanb by ISH. (i) Wild-type, (ii) adgrg6tb233c mutant treated with DMSO as a control, (iii–vii) treatment of adgrg6tb233c mutants with test compounds at 25 µM, with the exception of nilvadipine, which was tested at 22.5 µM. (viii–xiv) mbp mRNA expression of embryos treated as indicated above. Black arrowheads indicate mbp expression around the PLLg; white arrowhead in (ix) indicates the position of the PLLg in the untreated mutant, lacking mbp expression. Nifedipine, cilnidipine, tracazolate hydrochloride and nilvadipine all rescued mbp expression around the PLLg, whereas FPL 64176 did not rescue mbp expression around the PLLg so efficiently. (xv–xix) Representation of the chemical structures of the five compounds tested. Scale bar in (i), 50 µm (applies to i-vii); scale bar in viii, 50 µm (applies to viii–xiv).
|