
- Title
-
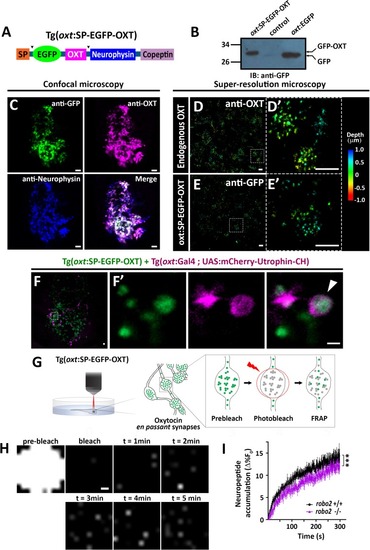
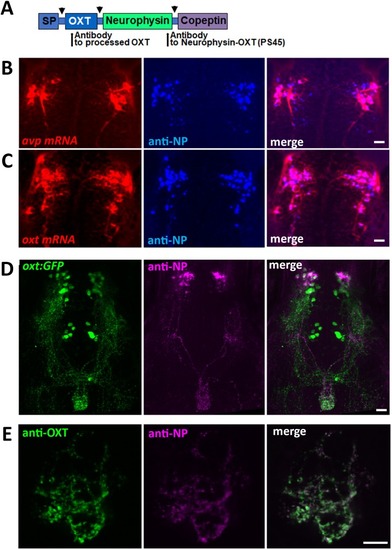
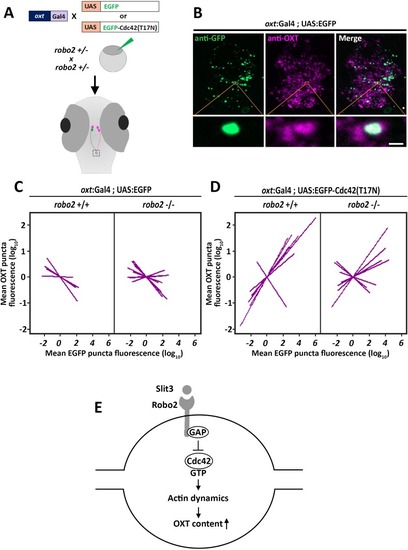
Robo2 regulates synaptic oxytocin content by affecting actin dynamics
- Authors
- Anbalagan, S., Blechman, J., Gliksberg, M., Gordon, L., Rotkopf, R., Dadosh, T., Shimoni, E., Levkowitz, G.
- Source
- Full text @ Elife

ZFIN is incorporating published figure images and captions as part of an ongoing project. Figures from some publications have not yet been curated, or are not available for display because of copyright restrictions. |
EXPRESSION / LABELING:
|
|
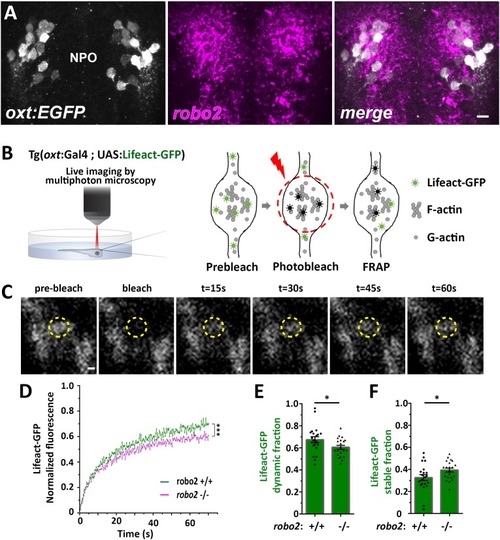
( The excel sheet includes values for FRAP data of neurohypophyseal synaptic Lifeact-EGFP in robo2 +/+ vs robo2 -/- larvae. The full-scale normalized values, dynamic and stable fraction generated from Easy-Frap software are shown. EXPRESSION / LABELING:
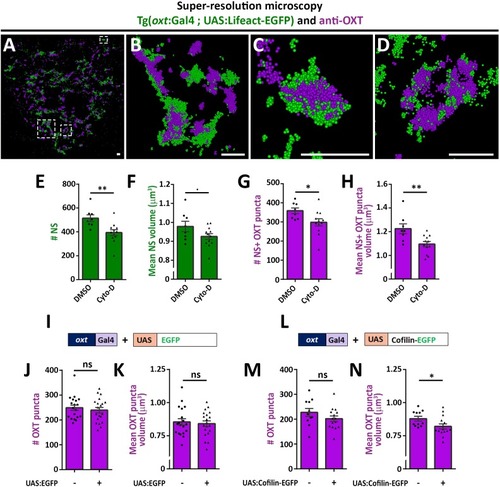
PHENOTYPE:
|
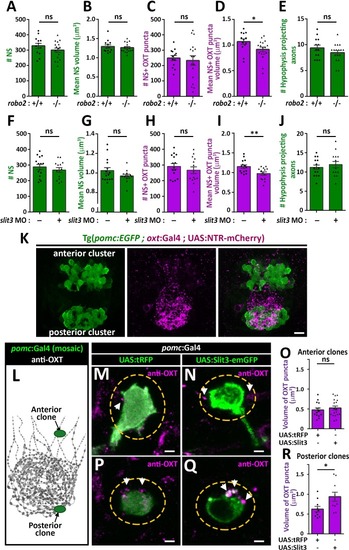
( The excel sheet includes values for number and volume of neurohypophyseal synapses and OXT puncta from confocal imaging of larval neurohypophysis of multiple experiments namely: 1) robo2 +/+ vs robo2 -/- 2) Mock vs morpholino-injected embryos 3) Mosaic transgenesis experiments by hypophyseal expression of tRFP vs slit3. |
( EXPRESSION / LABELING:
|
( |
( |