IMAGE

Figure 5

ID
ZDB-IMAGE-190723-1014
Genes
Antibodies
Source
Figures for Anbalagan et al., 2019
Image
Figure Caption

Figure 5 Slit3-Robo2 signaling regulates synaptic OXT levels.

(A–E) Assessment of synaptic oxytocin content in robo2 mutant was performed as described in Figure 1F. Graph showing the number and size of neurohypophyseal synapses (NS) (A,B) and colocalizing OXT puncta (C,D) and the number of neurohypophyseal projecting axons (E) in 8 days post-fertilization (dpf) robo2+/+ (n = 13) vs robo2-/- (n = 17) larvae (*p<0.05 Student’s t-test with Cohen's d = 0.82; ns denotes not significant). (F–J) Assessment of synaptic oxytocin content upon slit3 knock-down. Transgenic (oxt:EGFP) embryos were injected with injection buffer or injection buffer with 0.85 ng of morpholino targeted to the translational start site of slit3. Graph showing the number and size of NS (F,G) and colocalizing OXT puncta (H,I) and the number of neurohypophyseal projecting axons (J) in 8 days post-fertilization (dpf) control (n = 15) vs slit3 morpholino injected (n = 14) larvae (**p<0.05 with Cohen’s d = 1.23; ns denotes not significant, Student’s t-test). (K) Hypophyseal POMC cells are localized near OXT synapses. Confocal Z-stacks maximum intensity projection of hypophysis region of 5 day old triple transgenic (pomc:EGFP; oxt:Gal4; UAS:NTR-mCherry). The hypophysis area showing OXT NS adjacent to anterior and posterior clusters of POMC cells are shown. Scale: 10 μM. (L–R) Local overexpression in mosaic hypophyseal POMC clones located. Transgenic embryos expressing the pomc:Gal4 driver were injected with transposon-based transgenic vectors containing either control UAS:tRFP (M,P) or UAS: Slit3-EmGFP (N,Q). The injected 5-dpf larvae were subjected to immunostaining with anti-OXT protein and anti-GFP. OXT-puncta (arrows) within a distance of 2 μM (yellow dashed ellipse) from the clone surface were quantified. Scale bar: 2 µm. Bar graphs showing the mean volume of OXT puncta upon expression of tRFP vs Slit3 in hypophyseal POMC anterior (n = 15 and 18, respectively) or posterior clone (n = 10 and 10, respectively) position (*p<0.05 Student’s t-test with Cohen’s d = 1.14). Error bars indicate SEM in (A-J, O and R).

10.7554/eLife.45650.013Experimental data for <xref rid='fig5' ref-type='fig'>Figure 5</xref>: Neurohypophyseal synaptic parameters upon gain- or loss-of function of <italic>slit3</italic> or <italic>robo2</italic>.

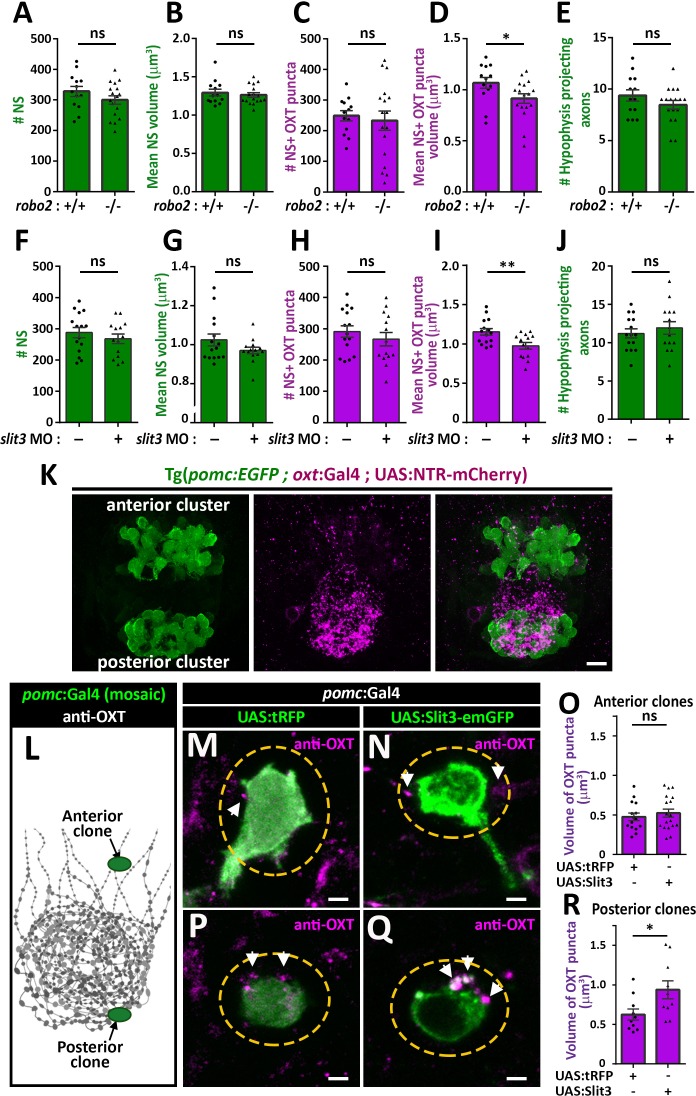
The excel sheet includes values for number and volume of neurohypophyseal synapses and OXT puncta from confocal imaging of larval neurohypophysis of multiple experiments namely: 1) robo2 +/+ vs robo2 -/- 2) Mock vs morpholino-injected embryos 3) Mosaic transgenesis experiments by hypophyseal expression of tRFP vs slit3.

Figure Data
Acknowledgments
This image is the copyrighted work of the attributed author or publisher, and ZFIN has permission only to display this image to its users. Additional permissions should be obtained from the applicable author or publisher of the image. Full text @ Elife