
- Title
-
Bulk Actin Dynamics Drive Phase Segregation in Zebrafish Oocytes
- Authors
- Shamipour, S., Kardos, R., Xue, S.L., Hof, B., Hannezo, E., Heisenberg, C.P.
- Source
- Full text @ Cell
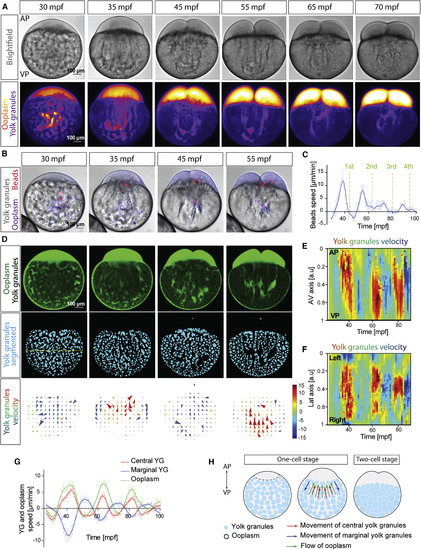
Dynamics of Ooplasm-Yolk Granules Segregation (A) Bright-field (top row) and fluorescence (dextran labeling the ooplasm, bottom row) images of zebrafish oocytes from 30–70 min post fertilization(mpf). AP, animal pole; VP, vegetal pole. (B) Images of oocytes injected with dextran (magenta) and beads (red, 2 μm) to mark ooplasm flows. (C) Averaged speed of injected beads during the first 100 mpf. Green dashed lines mark the first 4 cleavages. N = 3 experiments, n = 7 oocytes. (D) Images of oocytes expressing Rac1-NGreen to mark ooplasm and yolk granules (YGs, top row), YGs segmented from the images above (middle row), and particle image velocimetry (PIV) analysis of YG movements (bottom row; + velocities, animalward; − velocities, vegetalward; in μm/min). Dashed line in the middle row of the left panel marks the lateral axis of the oocyte. (E and F) Kymographs of YGs velocity along the animal-vegetal (AV; E) and lateral axes of the oocyte (F) as a function of time. Velocity is color-coded as in (D). (G) Averaged flow speed of central and marginal YGs (red and blue) and ooplasm (green) over time. Ooplasm flows were measured by segmenting the ooplasm from Rac1-NGreen expressing oocytes and performing PIV. N = 3, n = 7. (H) Schematic illustrating ooplasm and YG flow patterns in the oocyte. |
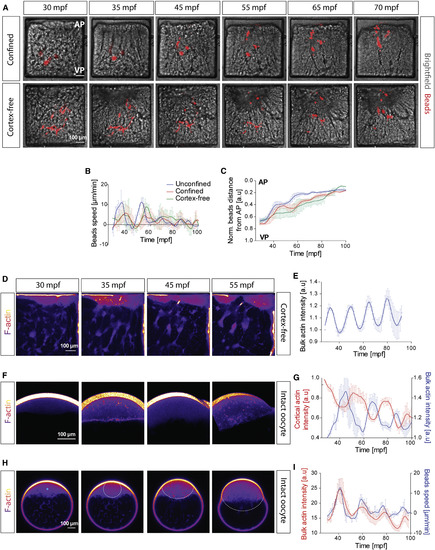
Requirement of the Actomyosin Cortex for Ooplasm-Yolk Granules Segregation and Spatiotemporal Correlation between Ooplasm Flows and Periodic Bulk Actomyosin Waves (A) Images of oocytes injected with beads (red) to mark ooplasm flows. Intact oocytes (top row) and oocytes with fragmented actomyosin cortex (“cortex-free,” bottom row) confined in square-shaped boxes. (B and C) Averaged speed (B) and distance from the animal pole (C, normalized to the AV axis) of injected beads in unconfined control (blue, N = 1 experiment, n = 3 oocytes), confined (red; N = 3, n = 5) and confined and cortex-free oocytes (green; N = 3, n = 3). (D) Images of cortex-free oocytes expressing Utr-GFP to mark F-actin. (E) Normalized bulk actin intensity of cortex-free oocytes during the first 100 min post fertilization (mpf). N = 1, n = 3. (F) Images of F-actin in the blastodisc of oocytes. (G) Normalized cortical (red, left axis, N = 1, n = 3) and bulk (blue, right axis, N = 1, n = 4) actin intensity during the first 100 mpf. (H) Images of F-actin in oocytes. Blue point in left panel marks the center of the bulk actin polymerization wave. Dashed line outlines the boundary of the bulk actin polymerization wave. (I) Averaged bulk actin intensity (red, left axis) and flow speed (blue, right axis) during the first 100 mpf. N = 1, n = 3. |

Regulation of Periodic Actin Polymerization Waves by the Cleavage Cycle Oscillator (A) Images of the blastodisc of oocytes expressing DCLK-GFP and Utr-mCherry to mark microtubules and F-actin, respectively, during the first cell cycle. (B) Schematic illustrating the embryonic cell-cycle oscillator and its regulation of bulk actin polymerization. (C) Normalized bulk actin intensity in control (blue, N = 1 experiment, n = 2 oocytes, measured on 5 different stacks: z = 5), Wee1 inhibitor treated (red, N = 1, n = 2, z = 6), Chk1 overexpressing (Chk1-OE, green, N = 1, n = 2, z = 10) and Cdk1 inhibitor treated (black, N = 2, n = 6, z = 6) oocytes during the first 100 mpf. Arrowheads indicate peaks of bulk actin intensities. (D) Periodicity of bulk actin oscillations for the conditions described in (C). ∗p = 0.0253, ∗∗p = 0.0095, ∗∗∗∗p < 0.001, unpaired t test. (E) Periodicity of bulk actin oscillations (same data as in C) and YGs movements for the conditions described in (C). For YG movements: control (N = 2, n = 6), Wee1 inhibitor (N = 2, n = 4), Chk1-OE (N = 2, n = 8), Cdk1 inhibitor (N = 2, n = 4). (F) Images of mini-oocytes marking F-actin, obtained from the animal (A) half (top row) or vegetal (V) half (bottom row) of an oocyte. Panels boxed in gold correspond to the onset of the bulk actin polymerization wave. (G) Bulk actin intensity in the A (red) and V (blue) mini-oocytes during the first 100 mpf. N = 1, n = 3 for each case. (H) Onset of bulk actin polymerization waves in A and V mini-oocytes, their onset delay, and expected delay calculated from the speed of the polymerization wave as shown in Figure S3D. Box and whiskers, min to max. N = 4, n = 13 (for each A and V mini-oocytes). ∗∗∗∗p < 0.001, Mann-Whitney test. Error bars, SEM, except in (E), SD. |

Contractility-Driven Actin Network Flows during Ooplasm-Yolk Granules Segregation (A) Images of oocytes expressing Utr-GFP to mark F-actin. The yellow ROIs indicate ooplasmic pockets across the oocyte, where actin intensity was measured in (A′). (A′) Normalized intensity of the bulk actin within the ooplasm along the oocyte animal-vegetal (AV) axis prior to (cyan) and during (magenta) bulk actin polymerization wave. N = 4 experiments, n = 7 oocytes. ∗∗∗∗p < 0.001, ns, not significant, Mann-Whitney test. (B) Schematic illustrating the vegetalward movement of the bulk actin polymerization wave (green) and animalward flows of bulk actin (red) along the actin gradient shown in (A′). (C) High magnification images of marginal regions of the oocyte marking F-actin. (C′) Kymograph of actin intensity observed in (C) along the AV axis as a function of time. White dashed line outlines the boundary of the bulk actin polymerization wave. Hot-to-cold color coding corresponds to high-to-low actin intensity. (D) PIV analysis of F-actin flows in the regions of the oocyte shown in (C). Color code ranges from high (red) to low absolute velocities (blue); in μm/min. (D′) Kymograph of actin velocities along the AV axis of the oocyte as a function of time. Velocity is color coded as in (D). (E) Images of oocytes marking F-actin during bulk actin network laser ablation. Yellow dashed line, laser ablation site. Arrowheads outline recoil of the actin network around the cut. (F) Recoil distance of the cut actin network prior (red, N = 3, n = 15) and during (blue, N = 5, n = 13) bulk actin polymerization wave, calculated from kymographs as shown in Figures S5D and S5E. |

Generation and Directionality of F-Actin Flows within the Oocyte (A) Theoretical prediction of fluid accumulation along the AV axis of the oocyte in the presence of a pre-patterned actin gradient. (B) Theoretical (left) and experimental (right) kymographs of F-actin intensity along the AV axis of the oocyte during phase segregation. Numerical simulations were performed with a pre-patterned gradient of actin as in (A) and noisy initial conditions. (C) Theoretical prediction of fluid accumulation along the animal-vegetal (AV) oocyte axis in the absence of a pre-patterned F-actin gradient. (D) Bulk actin intensity along the AV oocyte axis prior to bulk actin polymerization wave formation for control (DMSO, blue, N = 3 experiments, n = 3 oocytes) and cytochalasin B-treated (CytoB, green, N = 3, n = 5) oocytes (top plot), and for control (DMSO, blue, N = 4, n = 6) and jasplakinolide-treated (Jasp, red, N = 5, n = 12) oocytes (bottom plot). (E) Images (first two columns from the left) of oocytes expressing Utr-GFP to mark F-actin treated with CytoB (top row) and Jasp (bottom row) prior and during wave formation. Third column from the left: averaged velocity vector field of bulk actin flows during the first actin wave. + velocities, animalward flows; − negative velocities, vegetalward flows; in μm/min. Fourth column from the left: bright-field (BF) images of oocytes treated with CytoB (top panel) and Jasp (bottom panel) after the second cleavage. (F) Theoretical (left, taken from the numerical simulations of C) and experimental (measured from E; treated with CytoB [middle] or Jasp [right]) kymographs of bulk actin intensity along the AV axis of oocytes as a function of time. Hot-to-cold color coding corresponds to high-to-low actin intensity. Error bars, SEM. Mann-Whitney test, ns, not significant, ∗p = 0.0421, ∗∗p = 0.0054. |

Actin Comet Formation in Ooplasm-Yolk Granules Segregation (A) YG velocity vector field taken from 2D flow simulations with a zero-stress blastodisc-YGs interface (BYI). The box corresponds to zoomed-in view of YGs velocity vector field at BYI. Color code ranges from high + (red) to high − (blue) velocities. (B) Images of oocytes expressing Rac1-NGreen to mark ooplasm and YGs. Dashed white lines indicate BYI. (C) Averaged central BYI displacement (cyan, left axis) and ooplasm flow velocity (magenta, right axis) from 30–70 mpf. N = 3 experiment, n = 5 oocytes. Ooplasm flow velocity data are taken from Figure 1G. The green and golden boxes indicate the straightening and protruding phases when the central BYI changes its shape. (D) Images of oocytes expressing Utr-GFP to mark F-actin (red) and exposed to NileRed to mark YGs (green). White and blue boxes indicate the ROIs used for measuring actin intensity in the ooplasm or on the YGs surface in D′, respectively. Yellow ROI indicates the area used for zoomed-in images in (D″). (D′) Ratio of actin intensities on YGs surface (blue box in D) relative to ooplasm (white box in D) during bulk actin polymerization wave. N = 3, n = 3. (D″) Zoomed-in view of YGs and bulk actin at the ROI indicated in (D). Arrowheads demarcate the formation of actin comets on the ooplasm facing side of YGs. (E) Averaged displacement of YGs at the BYI during bulk actin polymerization wave. Period of wave propagation is marked in green. N = 2, n = 2. (F) Kymograph of YGs (green) and F-actin (red) displacement along the AV axis as a function of time. Kymograph was taken at the position within the oocyte marked by white dashed line in (D, left panel). Arrowheads demarcate actin on YGs surface. (G) Images of F-actin in oocytes. Yellow arrowheads indicate comet formation events around several YGs at the BYI. (H) Images of F-actin (red) and YGs (green and segmented in cyan) in oocytes. (I) Measured (left, averaged from PIV analysis of YGs over the first 5 min of the first protruding phase, N = 1, n = 3) and simulated (right, in the absence of stress at BYI) YGs velocity vector fields during the protruding phase. Color code ranges from high + (red) to high − (blue) velocities. (I′) Measured (left, averaged from PIV analysis of YGs over the first 5 min of the second straightening phase, N = 1, n = 3) and simulated (right, in the presence of stress at BYI) YGs velocity vector fields during the straightening phase. The box corresponds to zoomed-in view of YGs velocities at BYI. (J) Images of F-actin in WT (top row) and dchs mutant (bottom row) oocytes during the first two actin polymerization waves. Arrowheads indicate actin comet formation on YGs surface at BYI. (K) Ratio of actin intensities on YGs surface relative to ooplasm during bulk actin polymerization wave for WT (cyan, N = 3, n = 6, same data as in D′) and dchs mutant oocytes (magenta, N = 3, n = 8). (L) Amplitudes of actin oscillations during the first three actin polymerization waves for WT (cyan, N = 3, n = 5) and dchs mutant oocytes (magenta, N = 3, n = 5). Error bars, SEM. Mann-Whitney tests, ns, not significant, ∗∗∗∗p < 0.001. |

Spatiotemporal Correlation between Ooplasm Flows and Changes in Cortical Actomyosin, Related to Figure 2 (A) Fluorescence images of oocytes expressing Utr-GFP to mark F-actin. Scale bar, 50 μm. (B) Averaged cortical actin intensity (red, left y axis, N = 3 experiments, n = 3 oocytes) and beads speed as readout of ooplasm flows (blue, N = 3 experiments, n = 7 oocytes, taken from Figure 1C.) during the first 100 mpf. Error bars, SEM (C) Averaged length of the cortex at the animal pole (AP) of the oocyte as readout of animal pole deformation during the first ooplasm flow cycle. Error bars, SEM. N = 3 experiments, n = 6 oocytes. (D) Fluorescence images of UV laser cuts of the cortex at the animal pole of oocytes expressing Utr-GFP to mark F-actin. Left and right panels show cortex before and after the cut, respectively. Scale bar, 15 μm. (D’) particle image velocimetry (PIV) analysis of cortical flows surrounding the cut (outlined by golden box in middle panel) following the cut. Scale bar, 5 μm. (E) Recoil velocity of the actin cortex as a function of frames post cut (each frame is 200 ms) at 3 different stages of the oocyte: 15-30 mpf (red, before the first cycle of ooplasm flow), 30-40 mpf (green, during the first cycle of ooplasm flow), and 40-50 mpf (blue, after the first cycle of ooplasm flow). Error bars, SEM (F) Initial recoil velocities for the different conditions described in (E) calculated shown as kernel densities (top) and box whisker plots (bottom). Color codes are as described in (E). **p=0.0019, ns: not significant, Mann-Whitney test. (G) Schematic illustrating how changes in cortical tension at the animal pole of the oocyte could trigger ooplasm flows. |

Requirement of the Actomyosin Cytoskeleton for Ooplasm-Yolk Granules Segregation, Related to Figure 2 (A) Fluorescence/bright-field images of oocytes exposed to DMSO (control), Nocodazole (50μg/ml) or Cytochalasin B (Cyto B, 100μg/ml) or injected with CAMypt mRNA (85 pg/embryo) at 100 mpf. Oocytes were also injected with Dextran-Alexa Fluor 647 (cyan) to label the ooplasm, polystyrene beads (red, 2 μm) to track ooplasm flows, and Ras-eGFP (130 pg/embryo) for controlling the CAMypt overexpression experiments. Scale bars, 100 μm. (B) Averaged speed of injected beads as readout of ooplasm flows during the first 100 mpf. Upper plot: DMSO, blue with N = 3 experiments, n = 3 oocytes; Cytochalasin B (Cyto B), red with N = 3 experiments, n = 3 oocytes; Nocodazole, green with N = 4 experiments, n = 4 oocytes. Lower plot: Ras-eGFP, blue with N = 3 experiments, n = 3 oocytes; CAMypt, red with N = 2 experiments, n = 2 oocytes. (C) Normalized and averaged distance of beads to the animal pole of the oocyte during the first 100 mpf. Color coding and N/n as in (B). 0 and 1 on y axis correspond to animal and vegetal poles, respectively. (D) Averaged speed of marginal YGs marked by 1% NileRed during the first 100 mpf. Color coding and N/n as in (B). Error bars, SEM. |

Speed Analysis of Bulk F-Actin Polymerization Wave, Related to Figure 2 (A) Fluorescence image of an oocyte expressing Utr-GFP to mark F-actin. Semi-circles indicate the ROIs used for measuring the actin intensity in different distances from the center of the wave. Scale bar, 100 μm. (B) Averaged actin intensity for different distances from the wave center using the semi-circular ROIs as indicated in (A) for the duration of the first cycle (0-50 mpf). The dashed black arrow marks the maxima of each curve, indicating polymerization wave propagation. (C) Kymograph of actin movement along the animal-vegetal (AV) axis of the oocyte as a function of time. White dashed lines trace the bulk actin polymerization waves during the first 3 cleavages. Scale bars, 25 μm (y axis) and 10 min (x axis). (D) Speed of the actin polymerization wave. Box and whiskers, min to max. N = 4 experiments, n = 4 oocytes. |

Rheological Analysis of the Ooplasm, F-Actin, and Yolk Granules, Related to Figures 4 and 5 (A) Normalized and averaged intensity of the bulk actin within the ooplasm along the animal-vegetal (AV) axis of the oocyte prior to actin wave formation in unconfined (WT, data taken from Figure 4A′) and spatially confined (N = 3 experiments, n = 8 oocytes) oocytes. Error bars, SEM. Note that the gradient of bulk actin along the AV axis of the oocyte is preserved even when the oocyte is flattened (spatially confined), suggesting that the observed actin gradient is not due to signal quenching by YGs in the oocyte center. (B) Kymograph of actin intensity along the animal-vegetal (AV) axis of the oocyte as a function of time. Yellow arrowheads trace F-actin bundles flowing toward the animal pole (AP). Scale bars, 25 μm (y axis) and 2 min (x axis). (C) Fluorescence images of F-actin (magenta, left panel), Myosin-2 (cyan, middle panel) and merged F-actin & Myosin-2 (right panel), illustrating their colocalization. Scale bars, 50 μm. (D) Kymograph of F-actin intensity along the line perpendicular to the laser ablation site and prior to actin polymerization wave. Hot-to-cold color coding corresponds to high-to-low actin intensity. White arrowheads trace the recoil of the bulk actin after ablation. Scale bars, 5 μm (y axis) and 5 s (x axis). (E) Kymograph of F-actin intensity changes perpendicular to the laser ablation site after ablation during the bulk actin polymerization wave. Hot-to-cold color coding corresponds to high-to-low actin intensity. White arrowheads trace the recoil of the bulk actin network after ablation. Scale bars as in D. (E’) Initial recoil velocities measured for laser cuts performed prior (red) and during (blue) bulk actin polymerization wave formation, obtained by fitting a linear curve to the first four post-cut data points in Figure 5F and measuring the slope. Error bars, SEM ∗∗p=0.0037, Mann-Whitney test. (F) Fluorescence images of oocytes injected with 70 KDa Dextran-Alexa Fluor 647 to label the ooplasm for Fluorescence Recovery After Photobleaching (FRAP) experiments. Golden box outlines the bleached area (41.5 ∗ 8.3 μm2). Scale bar, 25 μm. (F’) Normalized and averaged Dextran intensity of the bleached area over time. N = 4 experiment, n = 36 oocytes. Calculated diffusion coefficient and corresponding ooplasmic viscosity (from Stokes-Einstein relationship; for details see STAR Methods): 1.9 μm2/s and 20 mPa.s (G) Bright-field images of oocytes before (left column) and at the end (right column) of pipette aspiration to measure ooplasm viscosity within the blastodisc dominated by F-actin. Scale bar, 100 μm. Black arrowhead indicates how far the ooplasm has flown in the pipette. (G’) Box and whiskers plot of measured blastodisc viscosities from pipette aspiration assay. “+” sign indicates the mean. N = 3 experiments, n = 23 oocytes. (G’’) Box and whiskers plot of measured blastodisc viscosities from pipette aspiration assay in DMSO (Cyan, N = 3 experiments, n = 15 oocytes) and Cytochalasin B (Cyto B, magenta, N = 4 experiments, n = 16 oocytes) treated oocytes. This result indicates that the bulk actin accounts largely for the measured blastodisc viscosity in control oocytes. “+” signs indicate the mean. ∗∗∗∗p < 0.001, Mann-Whitney test. (H) Box and whiskers plot of YGs mesh size obtained by measuring the shortest axis of fluid pockets between YGs. “+” sign indicates the mean. N = 3 experiments, n = 3 oocytes. (I) Bright-field images of oocytes before (left column) and at the end (right column) of pipette aspiration to measure YGs viscosity. Scale bar, 100 μm. Black arrowhead indicates how far yolk has flown in the pipette. (I’) Averaged yolk tongue displacement (deformation) during the aspiration and relaxation time points. Black arrowhead indicates the end of aspiration. N = 3 experiments, n = 21 oocytes. Error bars, SEM (I’’) Box and whiskers plot of measured yolk viscosities from pipette aspiration assay. “+” sign indicates the mean. N = 3 experiments, n = 26 oocytes. (J) Normalized ooplasm flow velocities away from the peak of the flows and along the animal-vegetal (AV) axis of the oocyte (averaged for the duration of the first cell cycle). Solid line, exponential fit with the length scale of ∼160μm. Error bars, SD. N = 1 experiment, n = 3 oocytes. |

Actin Comet Formation in Ooplasm-Yolk Granules Segregation, Related to Figure 7 (A) Normalized ooplasm accumulation along the lateral (Lat) axis of the oocyte. N = 2 experiments, n = 6 oocytes. Error bars, SEM 0 and 300 μm correspond to the center and margin of the oocyte, respectively. (B) Shape of the blastodisc-YGs interface (BYI) of the oocyte at 30 mpf (red) and 35 mpf (blue). N = 3 experiments, n = 3 oocytes. Error bars, SEM (C) Kymograph of ooplasm and YGs marked by Rac1-NGreen taken along a midline in Figure 7B. White dashed line outlines BYI during the first three cell cycles. Scale bars, 25 μm (y axis) and 10 min (x axis). (D) Fluorescence image of oocytes expressing Utr-GFP to mark F-actin (red) and exposed to NileRed to mark YGs (green). Same oocyte as in Figure 7D. Yellow ROI indicates the area used for zoomed-in images in (D’). Scale bar, 100 μm. (D’) Zoomed-in view of YGs and bulk actin at the ROI indicated in (D). Arrowheads indicate the formation of actin comets on the ooplasm facing side of YGs. Scale bar, 25 μm. (E) Fluorescence image of oocytes expressing Utr-GFP exposed to DMSO (control), CK666 (Arp2/3 inhibitor, 300μM) or SMIFH2 (Formin inhibitor, 300μM). Yellow and white boxes indicate the ROIs used for measuring actin on YGs surfaces in (E’). Scale bar, 25 μm. (E’) Differential actin intensities during actin bulk actin polymerization wave propagation (white boxes) normalized to actin prior to wave formation (yellow boxes) on YGs surface for control (DMSO, blue, N = 3 experiments, n = 5 oocytes), CK666-treated (green, N = 3 experiments, n = 6 oocytes) and SMIFH2-treated (red, N = 3 experiments, n = 6 oocytes) oocytes. Error bars, SEM ∗∗∗∗p<0.0001, ns: not significant, Mann-Whitney test. (F) Fluorescence images of oocytes expressing Utr-GFP to mark F-actin with additional YGs transplanted from a donor oocyte into its blastodisc prior to bulk actin polymerization wave formation at 24, 30 and 41 mpf. Scale bar, 100 μm. (F’) Kymograph of actin intensity marked by Utr-GFP expression along the yellow dashed line in (F) as a function of time. Hot-to-cold color coding corresponds to high-to-low actin intensity. Scale bars, 50 μm (y axis) and 2 min (x axis). (G) Schematic illustrating the vegetalward movement of the bulk actin polymerization wave (green), flows of bulk actin toward the animal pole (red), and actin comet formation at BYI, pushing YGs toward the vegetal pole. Green dashed line outlines the leading front of the bulk actin polymerization wave. (H) Fluorescence images of dchsmutant oocytes expressing Utr-GFP to mark F-actin, with several of the “escaping” YGs being segmented. Scale, 100 μm. |
Reprinted from Cell, 177(6), Shamipour, S., Kardos, R., Xue, S.L., Hof, B., Hannezo, E., Heisenberg, C.P., Bulk Actin Dynamics Drive Phase Segregation in Zebrafish Oocytes, 1463-1479.e18, Copyright (2019) with permission from Elsevier. Full text @ Cell