
|
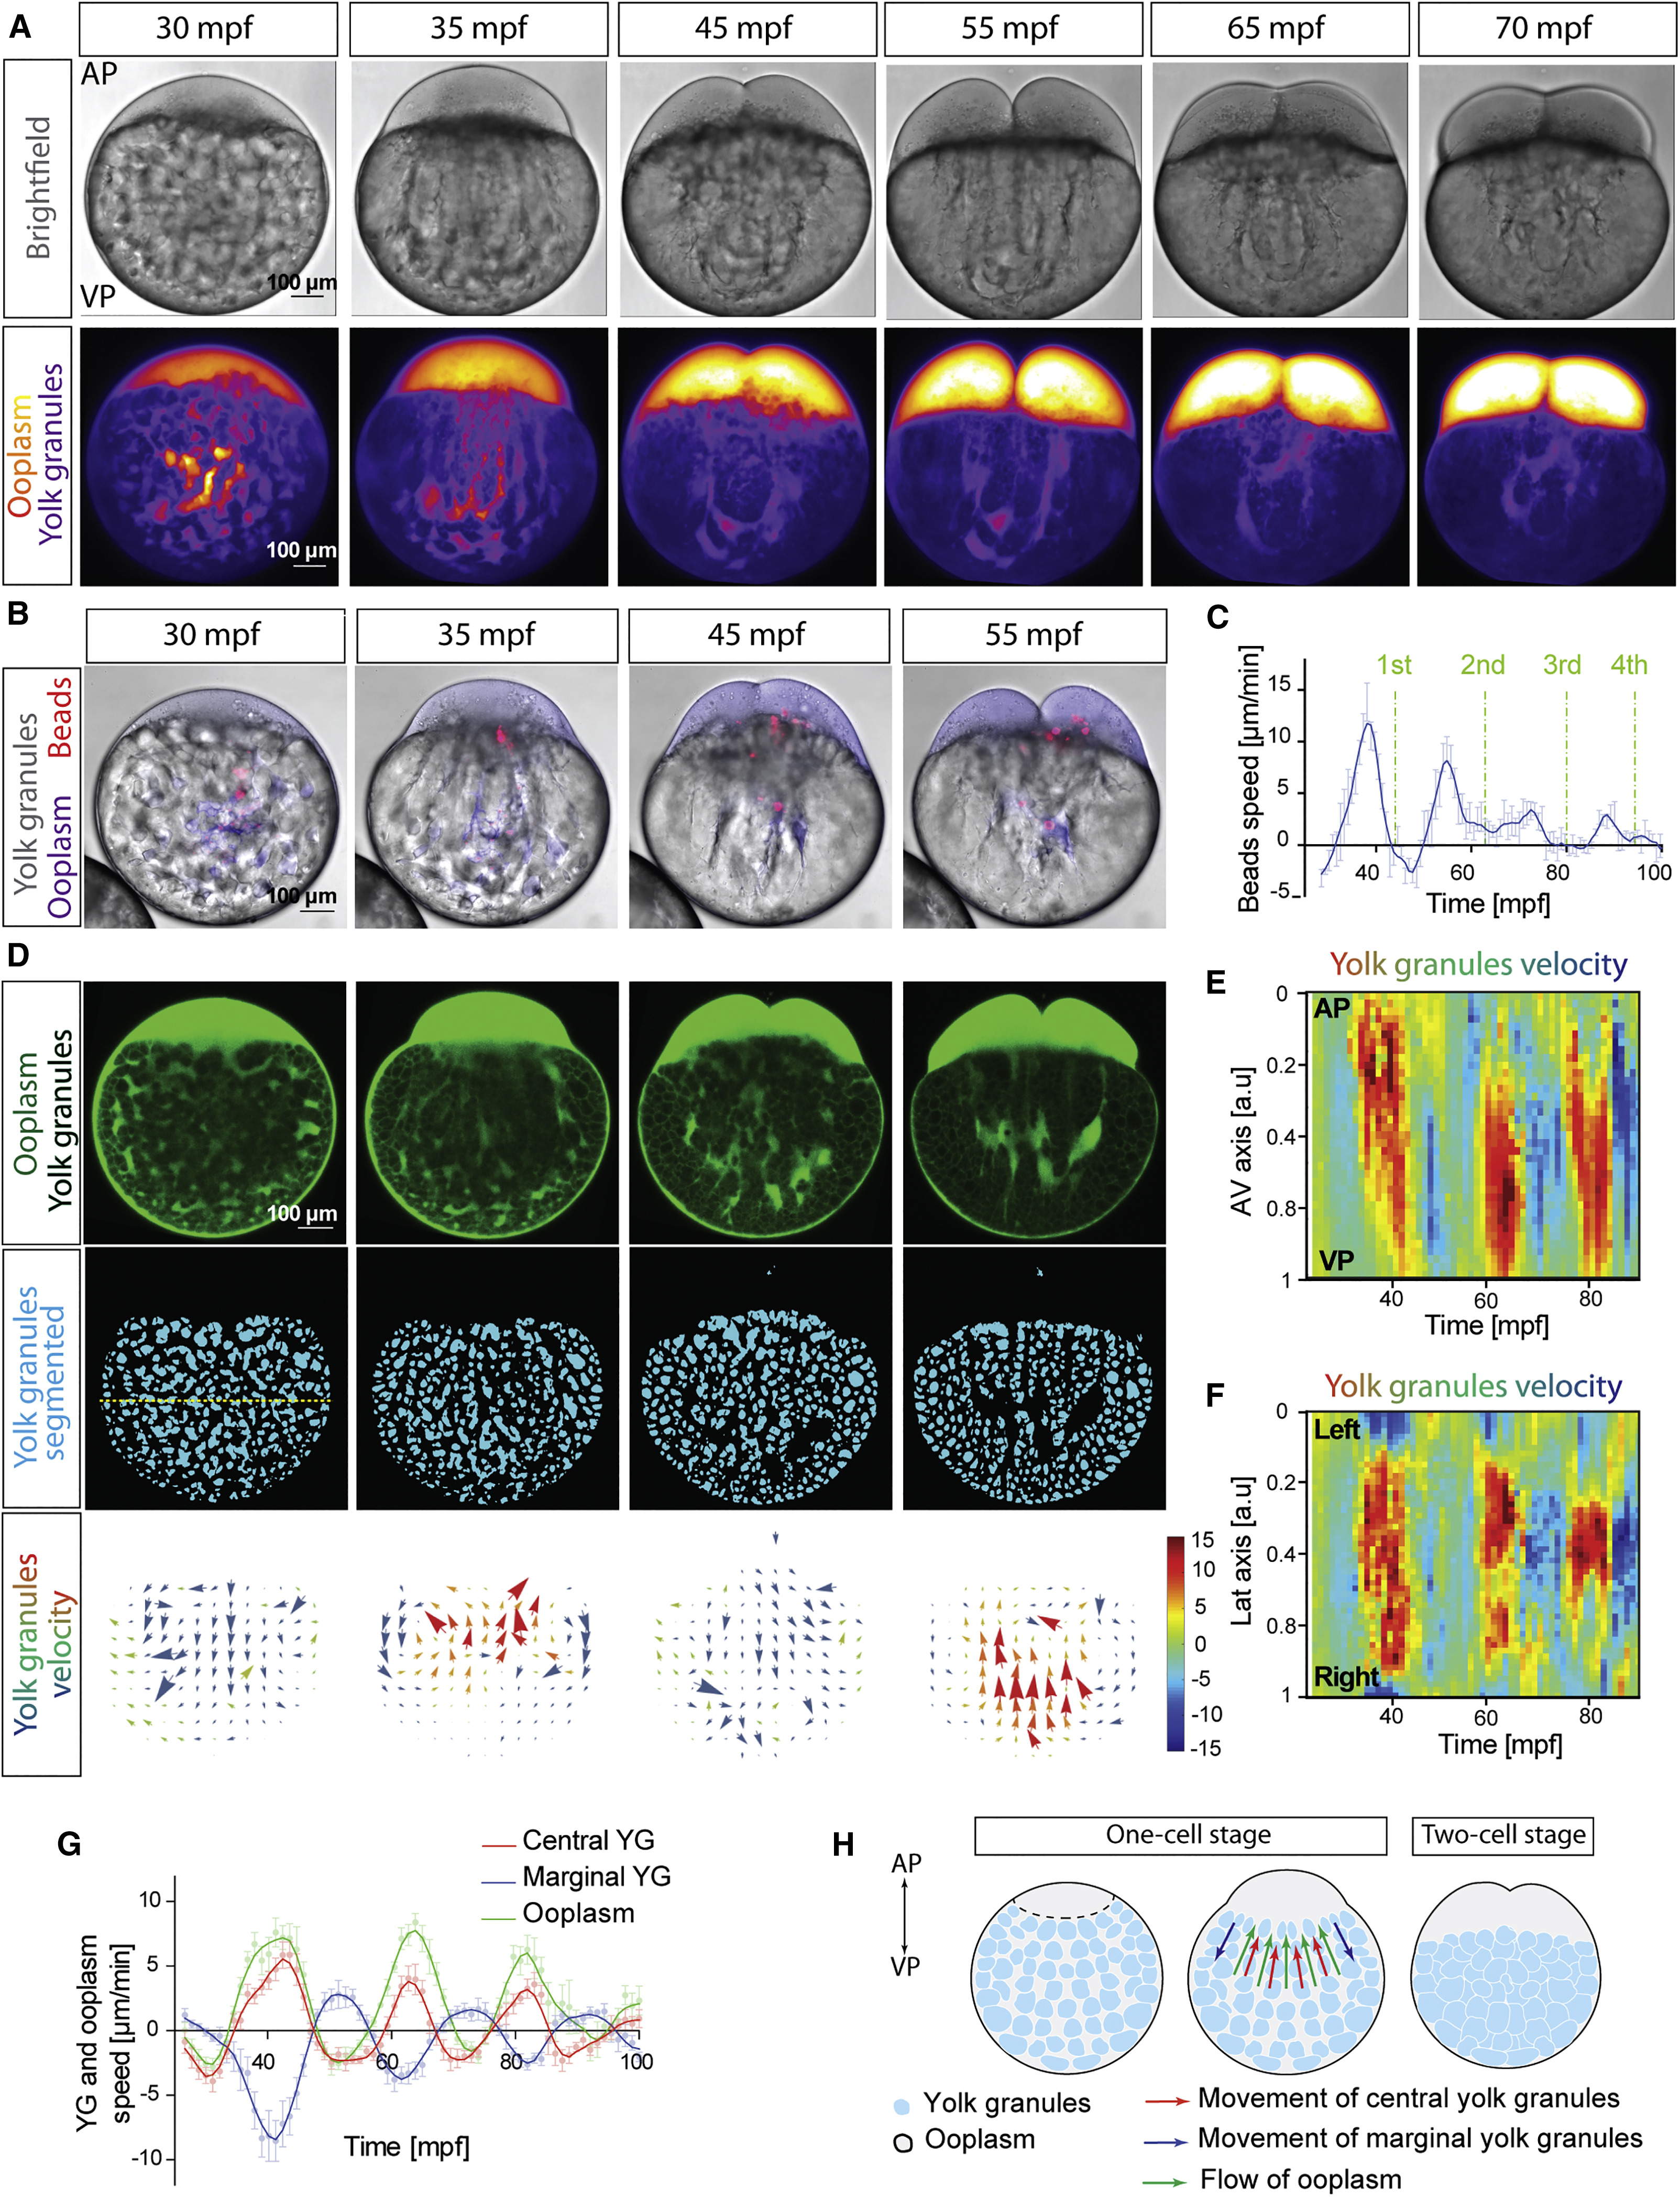
Fig. 1
Dynamics of Ooplasm-Yolk Granules Segregation
(A) Bright-field (top row) and fluorescence (dextran labeling the ooplasm, bottom row) images of zebrafish oocytes from 30–70 min post fertilization(mpf). AP, animal pole; VP, vegetal pole.
(B) Images of oocytes injected with dextran (magenta) and beads (red, 2 μm) to mark ooplasm flows.
(C) Averaged speed of injected beads during the first 100 mpf. Green dashed lines mark the first 4 cleavages. N = 3 experiments, n = 7 oocytes.
(D) Images of oocytes expressing Rac1-NGreen to mark ooplasm and yolk granules (YGs, top row), YGs segmented from the images above (middle row), and particle image velocimetry (PIV) analysis of YG movements (bottom row; + velocities, animalward; − velocities, vegetalward; in μm/min). Dashed line in the middle row of the left panel marks the lateral axis of the oocyte.
(E and F) Kymographs of YGs velocity along the animal-vegetal (AV; E) and lateral axes of the oocyte (F) as a function of time. Velocity is color-coded as in (D).
(G) Averaged flow speed of central and marginal YGs (red and blue) and ooplasm (green) over time. Ooplasm flows were measured by segmenting the ooplasm from Rac1-NGreen expressing oocytes and performing PIV. N = 3, n = 7.
(H) Schematic illustrating ooplasm and YG flow patterns in the oocyte.
Reprinted from Cell, 177(6), Shamipour, S., Kardos, R., Xue, S.L., Hof, B., Hannezo, E., Heisenberg, C.P., Bulk Actin Dynamics Drive Phase Segregation in Zebrafish Oocytes, 1463-1479.e18, Copyright (2019) with permission from Elsevier. Full text @ Cell