
- Title
-
Ca 2+ activity signatures of myelin sheath formation and growth in vivo
- Authors
- Baraban, M., Koudelka, S., Lyons, D.A.
- Source
- Full text @ Nat. Neurosci.
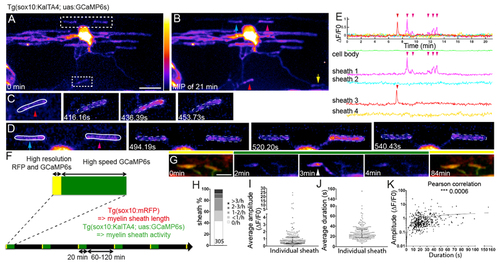
A. Maximum intensity projection of a 3D z-stack of the first time-point from a 21 minute-long movie of a GCaMP6s expressing oligodendrocyte. Two areas of interest indicated, top corresponding to D and bottom to C. Scale bar= 10µm. Fire LookUpTable reflects grey value range 0-65,535 (black to white). B. Maximum intensity projection of all time-points of cell shown in A. Arrowheads indicate sheaths with increased fluorescence, reflecting Ca2+ activity during the movie. Arrows point to sheaths with no increase. C, D, myelin sheaths demarcated within ROIs outlined in A, at indicated times. E. ΔF/F0 over time. Arrowheads indicate sheaths shown in corresponding colours in B, C and D. F. Schematic of time-lapse imaging experiment with interspersed imaging of cell morphology (yellow) and Ca2+ (green). G. Sample images of myelin sheath morphology (under yellow bars) with intervening periods of Ca2+ imaging (under green bar). Arrowhead points to Ca2+ transient in sheath. Scale bar=5µm. H. Distribution of Ca2+ transient frequencies of 305 sheaths, analysed in 18 animals. I. Distribution of average Ca2+ transient amplitude per sheath (187 sheaths from 18 animals). Graph shows median and 1st and 3rd quartiles. J. Distribution of average Ca2+ transient duration per sheath (187 sheaths from 18 animals). Graph shows median and 1st and 3rd quartiles. K. Correlation between amplitude and duration per individual Ca2+ transient events (448 events from 187 sheaths in 18 animals, Pearson’s Correlation Test, p=0.0006). |
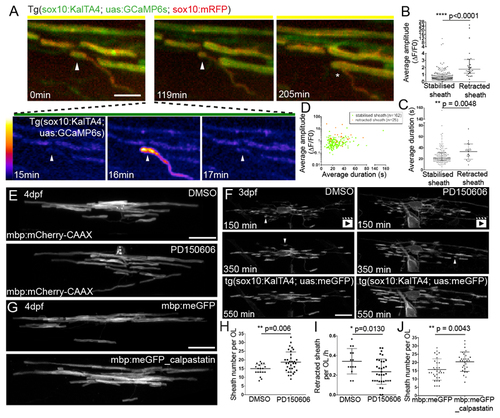
A. Frames from a time-lapse imaging experiment. The myelin sheath imaged in high-resolution mode (0 min) exhibits a Ca2+ transient 16 minutes into a period of high-speed GCaMP6s imaging (see also B. Average amplitude of Ca2+ transients in sheaths that are either stabilised or fully retracted (n=25 retracted sheaths, 12 animals and n=162 stabilised sheaths, 18 animals; Graph shows median and 1st and 3rd quartiles. Two-tailed Mann-Whitney test, p<0.0001. C. Average duration of Ca2+ transients in sheaths shown in B. Graph shows median and 1st and 3rd quartiles. Two-tailed Mann-Whitney test, p=0.0048. D. Average amplitude and average duration of transient events in sheaths that are stabilised (green) or fully retracted (orange). E. mbp:mCherry-CAAX expressing oligodendrocytes in control (top) and PD150606 treated animal (bottom) at 4 dpf. Scale bar= 10µm. Quantitation in 2H. F. Frames from time-lapse movies of oligodendrocytes during myelination in a DMSO treated (left) and PD150606 treated (right) animal. Arrowheads point to sheaths that are retracted. See also G. mbp:meGFP expressing oligodendrocytes (top) and mbp:meGFP-calpastatin (bottom) at 4 dpf. Scale bar= 10µm. Quantitation in 2J. H. Myelin sheath number per oligodendrocyte in DMSO and PD150606 treated animals (n=18 OLs from 18 DMSO-treated animals; n= 33 OLs from 33 PD150606-treated animals; Graph shows mean and SD. Two-tailed t-test, p=0.006). I. Rate of myelin sheath retraction per hour in DMSO and PD150606 treated animals as analysed by time-lapse microscopy. (n=14 OLs from 14 DMSO-treated animals and 34 OLs from 34 PD150606-treated animals. Graph shows mean and SD. Two-tailed t-test, p=0.013). J. Myelin sheath number per mbp:meGFP and mbp:meGFP-calpastatin expressing oligodendrocytes at 4 dpf. (n=31 OLs in 22 mbp:meGFP control animals, and n=29 OLs in 23 mbp:meGFP-calpastatin animals. Graph shows mean and SD. Two-tailed t-test, p=0.0043). |
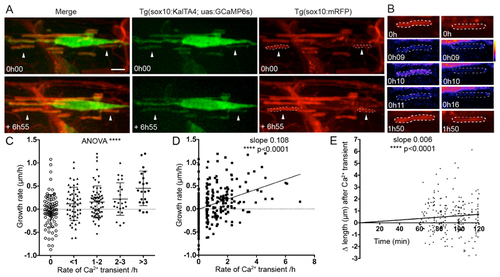
A. Images of a GCaMP6s expressing oligodendrocyte in a Tg(sox10:mRFP) background allows analysis of the growth and Ca2+ activity of individual isolated myelin sheaths, e.g. arrowheads over time. Top panels show initial time-point and bottom the same cell at the end of the movie almost 7 hours later. Scale bar= 5µm. B. Myelin sheaths indicated by arrowheads in A are outlined by ROIs and imaged over time. Note the Ca2+ transient at 0h 10 time-point in the sheath in the left column subsequently elongates. C. Growth rate of myelin sheaths (µm/h) related to number of Ca2+ transients per hour. (ANOVA p<0.0001, F=9.225. Two-tailed unpaired t-test, 0 vs >3 transients/h p<0.0001, 0 vs 2-3 transients/h p=0.0024, 0 vs 1-2 transients/h p=0.0011, 0 vs <1 transient/h p=0.0162, <1 vs >3 transients/h p=0.0006, 1-2 vs >3 transients/h p=0.0014, 2-3 vs >3 transients/h p=0.0376; 0 transient/h n=82 sheaths from 17 animals, <1 transient/h n=53 from 16 animals, 1-2 transients/h n=64 sheaths from 17 animals, 2-3 transients/h n=24 sheaths from 11 animals, >3 transients/h n=21 sheaths from 11 animals). Graph indicates means and standard deviations. D. Scatterplot analysis of growth rate of myelin sheaths (µm/h) related to number of Ca2+ transients per hour (Slope= 0.108. Pearson’s Correlation Test, p<0.0001, n=244 sheaths). E. Change in sheath length over time following 324 Ca2+ transients, with the time of all transients set as time 0 (slope 0.006, Linear Regression test, p<0.0001). |