
|
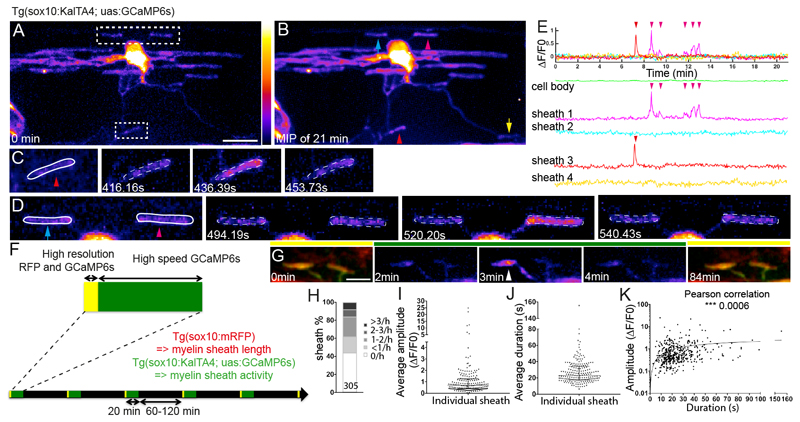
Figure 1
A. Maximum intensity projection of a 3D z-stack of the first time-point from a 21 minute-long movie of a GCaMP6s expressing oligodendrocyte. Two areas of interest indicated, top corresponding to D and bottom to C. Scale bar= 10µm. Fire LookUpTable reflects grey value range 0-65,535 (black to white).
B. Maximum intensity projection of all time-points of cell shown in A. Arrowheads indicate sheaths with increased fluorescence, reflecting Ca2+ activity during the movie. Arrows point to sheaths with no increase.
C, D, myelin sheaths demarcated within ROIs outlined in A, at indicated times.
E. ΔF/F0 over time. Arrowheads indicate sheaths shown in corresponding colours in B, C and D.
F. Schematic of time-lapse imaging experiment with interspersed imaging of cell morphology (yellow) and Ca2+ (green).
G. Sample images of myelin sheath morphology (under yellow bars) with intervening periods of Ca2+ imaging (under green bar). Arrowhead points to Ca2+ transient in sheath. Scale bar=5µm.
H. Distribution of Ca2+ transient frequencies of 305 sheaths, analysed in 18 animals.
I. Distribution of average Ca2+ transient amplitude per sheath (187 sheaths from 18 animals). Graph shows median and 1st and 3rd quartiles.
J. Distribution of average Ca2+ transient duration per sheath (187 sheaths from 18 animals). Graph shows median and 1st and 3rd quartiles.
K. Correlation between amplitude and duration per individual Ca2+ transient events (448 events from 187 sheaths in 18 animals, Pearson’s Correlation Test, p=0.0006).