
|
Figure 3
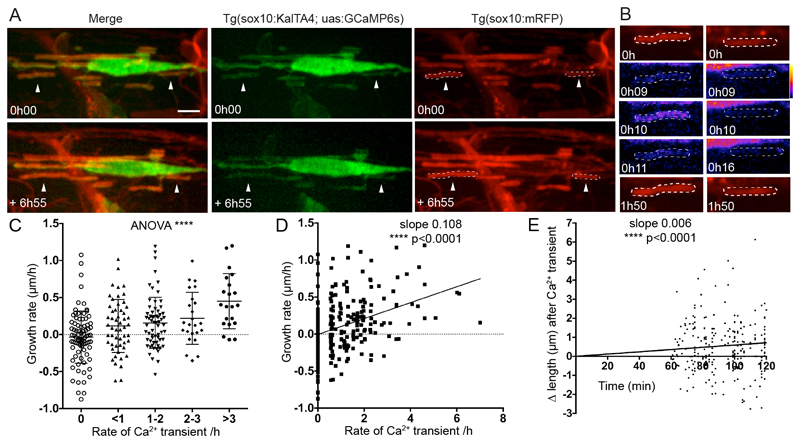
A. Images of a GCaMP6s expressing oligodendrocyte in a Tg(sox10:mRFP) background allows analysis of the growth and Ca2+ activity of individual isolated myelin sheaths, e.g. arrowheads over time. Top panels show initial time-point and bottom the same cell at the end of the movie almost 7 hours later. Scale bar= 5µm.
B. Myelin sheaths indicated by arrowheads in A are outlined by ROIs and imaged over time. Note the Ca2+ transient at 0h 10 time-point in the sheath in the left column subsequently elongates.
C. Growth rate of myelin sheaths (µm/h) related to number of Ca2+ transients per hour. (ANOVA p<0.0001, F=9.225. Two-tailed unpaired t-test, 0 vs >3 transients/h p<0.0001, 0 vs 2-3 transients/h p=0.0024, 0 vs 1-2 transients/h p=0.0011, 0 vs <1 transient/h p=0.0162, <1 vs >3 transients/h p=0.0006, 1-2 vs >3 transients/h p=0.0014, 2-3 vs >3 transients/h p=0.0376; 0 transient/h n=82 sheaths from 17 animals, <1 transient/h n=53 from 16 animals, 1-2 transients/h n=64 sheaths from 17 animals, 2-3 transients/h n=24 sheaths from 11 animals, >3 transients/h n=21 sheaths from 11 animals). Graph indicates means and standard deviations.
D. Scatterplot analysis of growth rate of myelin sheaths (µm/h) related to number of Ca2+ transients per hour (Slope= 0.108. Pearson’s Correlation Test, p<0.0001, n=244 sheaths).
E. Change in sheath length over time following 324 Ca2+ transients, with the time of all transients set as time 0 (slope 0.006, Linear Regression test, p<0.0001).