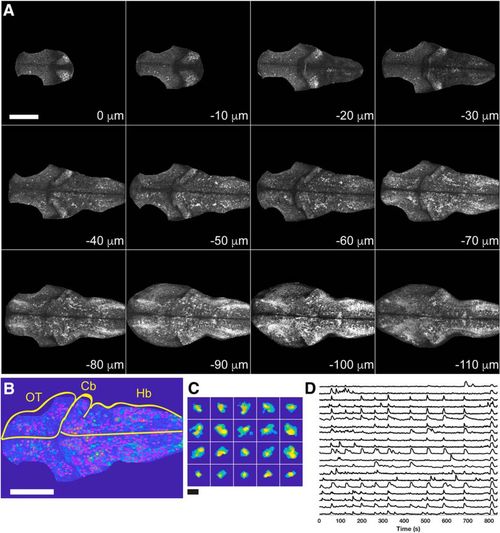
Two-photon imaging of GCaMP6s in zebrafish larvae. A, Each panel shows an optical section from a single time point of a movie collected in a 4 dpf zebrafish larva. Sections are arranged from dorsal (0 μm) to ventral (–110 μm). The brain was cropped to remove skin fluorescence and signal from the synaptic neuropil of the optic tectum. Scale bar = 100 μm. B, Detection of cells identified by constrained non-negative matrix factorization (Pnevmatikakis et al., 2016). ROIs outlined in magenta on top of an average image for a single imaging plane from a 4 dpf larva. Cb, cerebelleum; Hb, hindbrain; OT, optic tectum. Scale bar = 100 μm. C, Selected ROIs. Scale bar = 15 μm. D, Selected ΔF/F traces obtained from the segmented plane in BC.

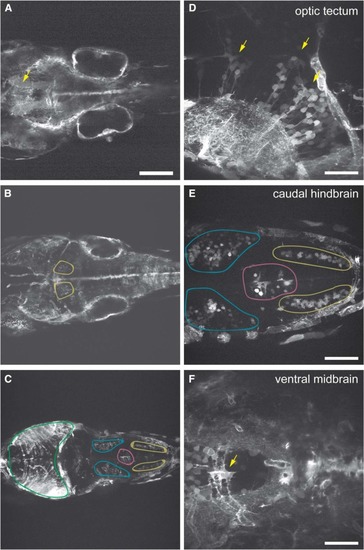
Expression of pcdh19 in BAC transgenic line. A–C, Distribution of pcdh19 expression in the midbrain and hindbrain of TgBAC(pcdh19:Gal4-VP16, 5xUAS:Lifeact-GFP) larvae at 4 dpf. In addition to neurons and neural progenitor cells, pcdh19 is expressed in the neurovasculature and epithelia within the developing ear. A, In the ventral brain, Lifeact-GFP labels both longitudinal (yellow arrow) and commissural axon bundles. B, Expression is evident in a bilateral cluster of neurons in the anterior hindbrain, which likely correspond to the ARTR (yellow regions). C, pcdh19 is also present in limited clusters of neurons in the hindbrain (blue, magenta and yellow regions) and optic tectum (green region). D–F, Higher magnification images show that within those regions that express pcdh19, it is present in only a fraction of neurons. D, As shown previously, pcdh19 is expressed in radial columns of neurons within the optic tectum (yellow arrows). E, In addition to the ARTR, pcdh19 labels bilateral clusters of neurons. F, In the ventral midbrain, pcdh19 labels small clusters of radial glia (yellow arrow), as well as neurons, axon tracts and vasculature. Scale bars = 125 μm (AC), 50 μm (D, F), and 63 μm (E).

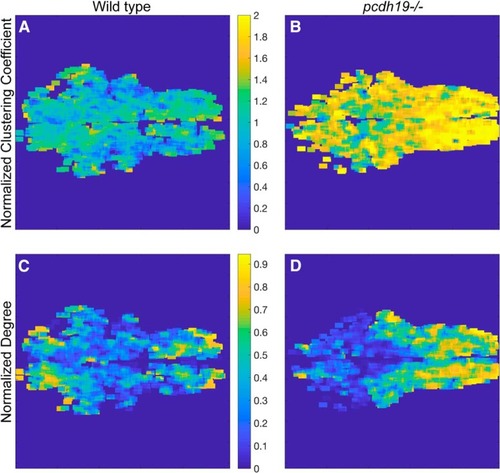
Spatial distribution of node-based measures in a 6 dpf larva. A, B, The normalized correlation coefficients were averaged in sliding 20 × 20 μm windows. Maps were generated from binarized networks that were thresholded at 0.7. The corresponding spatial maps show that there is little spatial organization in the distribution of clustering coefficients. Compared to wild-type larvae (A), there is a uniform elevation of the clustering coefficient throughout the brain in pcdh19 mutants (B). C, D, The node degree for each network was normalized to the largest degree in that network. These normalized node degrees were averaged in sliding 20 × 20 μm windows. Wild-type larvae (C) consistently showed regions of high degree nodes in the anterior midbrain and in the hindbrain. In pcdh19 mutants (D), there was a consistent spread of high degree nodes throughout the hindbrain.

Acknowledgments
This image is the copyrighted work of the attributed author or publisher, and ZFIN has permission only to display this image to its users. Additional permissions should be obtained from the applicable author or publisher of the image. Full text @ eNeuro