IMAGE

Figure 8.

ID
ZDB-IMAGE-190723-240
Source
Figures for Light et al., 2019
Image
Figure Caption

Figure 8.

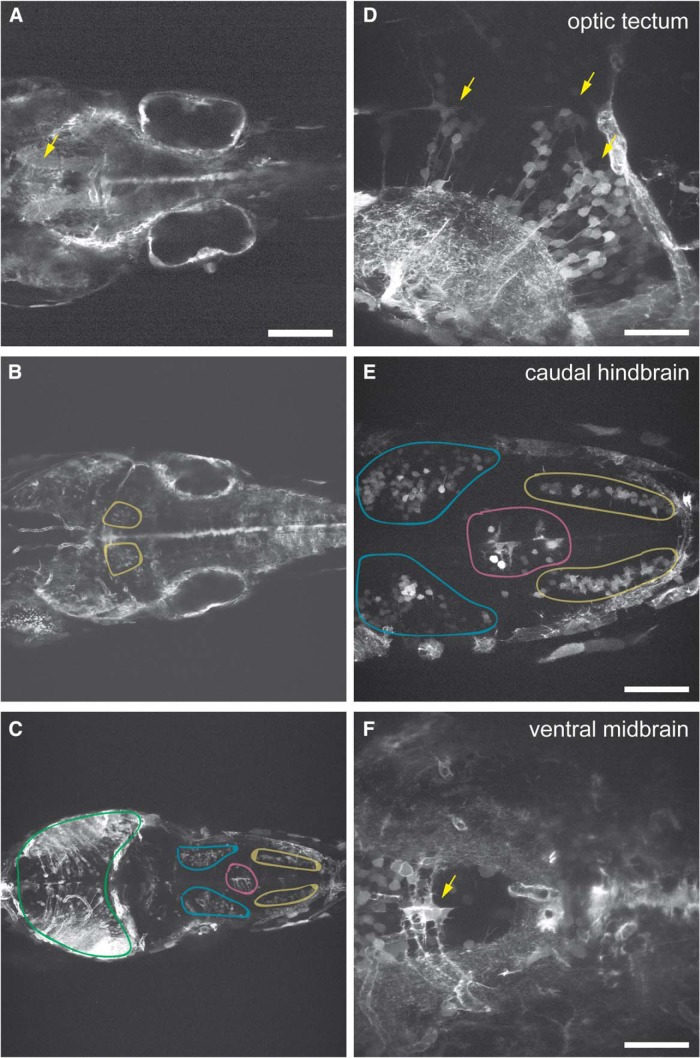
Expression of pcdh19 in BAC transgenic line. A–C, Distribution of pcdh19 expression in the midbrain and hindbrain of TgBAC(pcdh19:Gal4-VP16, 5xUAS:Lifeact-GFP) larvae at 4 dpf. In addition to neurons and neural progenitor cells, pcdh19 is expressed in the neurovasculature and epithelia within the developing ear. A, In the ventral brain, Lifeact-GFP labels both longitudinal (yellow arrow) and commissural axon bundles. B, Expression is evident in a bilateral cluster of neurons in the anterior hindbrain, which likely correspond to the ARTR (yellow regions). C, pcdh19 is also present in limited clusters of neurons in the hindbrain (blue, magenta and yellow regions) and optic tectum (green region). D–F, Higher magnification images show that within those regions that express pcdh19, it is present in only a fraction of neurons. D, As shown previously, pcdh19 is expressed in radial columns of neurons within the optic tectum (yellow arrows). E, In addition to the ARTR, pcdh19 labels bilateral clusters of neurons. F, In the ventral midbrain, pcdh19 labels small clusters of radial glia (yellow arrow), as well as neurons, axon tracts and vasculature. Scale bars = 125 μm (AC), 50 μm (D, F), and 63 μm (E).

Acknowledgments
This image is the copyrighted work of the attributed author or publisher, and ZFIN has permission only to display this image to its users. Additional permissions should be obtained from the applicable author or publisher of the image. Full text @ eNeuro