FIGURE

Figure 9.

ID
ZDB-FIG-190723-196
Publication
Light et al., 2019 - Multiplane calcium imaging reveals disrupted development of network topology in zebrafish pcdh19 mutants
Other Figures
All Figure Page
Back to All Figure Page
Figure 9.

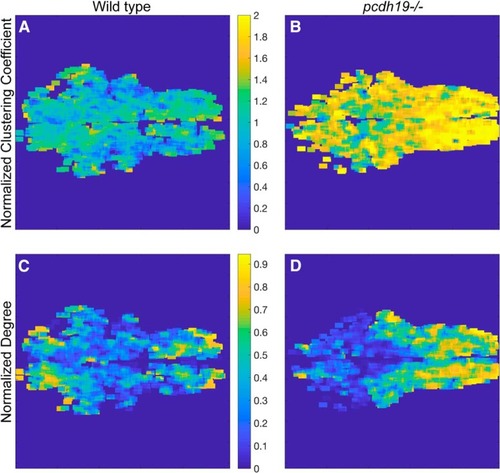
Spatial distribution of node-based measures in a 6 dpf larva. A, B, The normalized correlation coefficients were averaged in sliding 20 × 20 μm windows. Maps were generated from binarized networks that were thresholded at 0.7. The corresponding spatial maps show that there is little spatial organization in the distribution of clustering coefficients. Compared to wild-type larvae (A), there is a uniform elevation of the clustering coefficient throughout the brain in pcdh19 mutants (B). C, D, The node degree for each network was normalized to the largest degree in that network. These normalized node degrees were averaged in sliding 20 × 20 μm windows. Wild-type larvae (C) consistently showed regions of high degree nodes in the anterior midbrain and in the hindbrain. In pcdh19 mutants (D), there was a consistent spread of high degree nodes throughout the hindbrain.

Expression Data

Expression Detail
Antibody Labeling
Phenotype Data

Phenotype Detail
Acknowledgments
This image is the copyrighted work of the attributed author or publisher, and ZFIN has permission only to display this image to its users. Additional permissions should be obtained from the applicable author or publisher of the image. Full text @ eNeuro