
- Title
-
hdac4 mediates perichondral ossification and pharyngeal skeleton development in the zebrafish
- Authors
- DeLaurier, A., Alvarez, C.L., Wiggins, K.J.
- Source
- Full text @ Peer J.
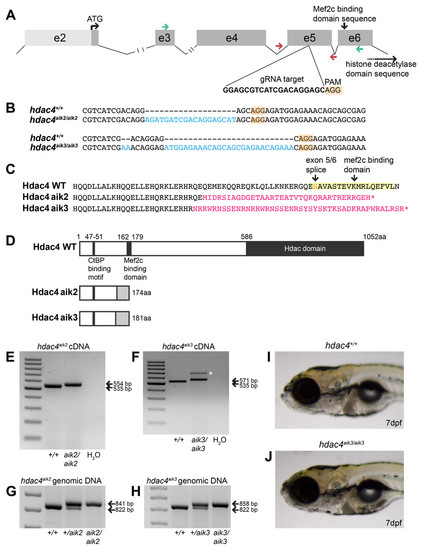
Overview of CRISPR strategy and generation of hdac4mutant lines.(A) Genomic structure of hdac4 showing gRNA target associated with the protospacer adjacent motif (5′-NGG, PAM) upstream of the Mef2c binding domain sequence. The histone deacetylase domain sequence is at the 3′ end of the gene. Green arrows indicate forward (exon 3F) and reverse (exon 6R) primers for RT-PCR and sequencing of cDNA. Red arrows indicate intronic genotyping primers (hdac4 F6, hdac4 R6) flanking exon 5. Intron 2/3 and 3/4 not to scale, indicated by hash marks. (B) Alignment of wild-type (hdac4+/+) with mutant cDNA sequence showing nucleotide insertions (blue) in hdac4aik2/aik2 and hdac4aik3/aik3 mutants in exon 5. (C and D) Insertion of nucleotides results in reading frame shifts causing aberrant protein sequences (magenta in C, grey boxes in D), loss of the Mef2c binding domain (indicated in yellow in C), and premature termination of the protein sequence (asterisk in C indicates stop codon). (E and F) RT-PCR showing hdac4 cDNA is spliced correctly in mutants and there is no evidence of splice variants. The wild-type cDNA product is expected to be 535 bp and mutant bands are 554 bp (E) and 571 bp (F). The larger band in hdac4aik3 mutants (indicated by white asterisk in (F) was sequenced and determined to be identical to the lower band. (G and H) Genomic DNA samples were genotyped by PCR and show differences in band sizes indicating mutant (841 bp hdac4aik2 mutant, 858 bp hdac4aik3 mutant), wild-type (822 bp), and heterozygous fish (mutant and wild-type bands). (I and J) At 7 dpf, mutant hdac4aik3 fish (J) have no apparent external abnormalities compared to wild-type siblings (I). H2O = negative control. 100 bp ladder. PHENOTYPE:
|
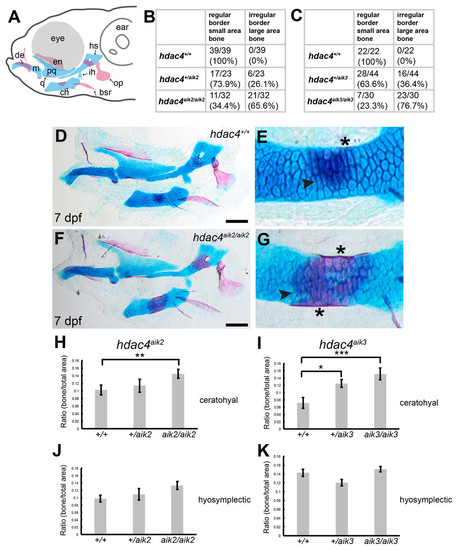
Analysis of ossification of the pharyngeal skeleton of hdac4 zygotic mutants stained using Alcian Blue and Alizarin Red dyes.(A) Schematic showing elements of the 7 dpf larvae pharyngeal skeleton, lateral view. Cartilage is indicated in blue, bone is indicated in red. (B and C) Total scores assigned to 7 dpf larvae scored for hdac4aik2 and hdac4aik3 lines, respectively. (D and E) Representative wild-type larval pharyngeal skeleton (D) and enlarged view (E) of ceratohyal showing small area (less than approximately 20% of total area of element) of bone formation, with even borders, indicated by arrow. Asterisk indicates perichondral bone collar. Lateral view. (F and G) Representative hdac4aik2 mutant pharyngeal skeleton (F) and enlarged view (G) of ceratohyal showing large area (greater than approximately 20% of total area of element) of bone formation, with irregular borders, indicated by arrow. Asterisks indicate perichondral bone collar. Lateral view. (H and I) Bar graphs comparing ratios of bone to total area of the ceratohyal for hdac4aik2 and hdac4aik3 lines. (J and K) Bar graphs comparing ratios of bone to total area of the hyosymplectic for hdac4aik2 and hdac4aik3 lines. Bars in graph represent means and error bars are standard errors of means (SEM). H, hdac4aik2: WT n = 38, mean = 0.102, SEM = 0.013; heterozygote n = 23, mean = 0.113, SEM = 0.017; and mutant n = 32, mean = 0.145, SEM = 0.0112. I, hdac4aik3: WT n = 17, mean = 0.071, SEM = 0.015; heterozygote n = 28, mean = 0.125, SEM = 0.011; and mutant n = 16 mean = 0.151, SEM = 0.016. J, hdac4aik2: WT n = 38, mean = 0.097, SEM = 0.009; heterozygote n = 23, mean = 0.109, SEM = 0.015; and mutant n = 32, mean = 0.133, SEM = 0.011. K, hdac4aik3: WT n = 17, mean = 0.142, SEM = 0.008; heterozygote n = 28, mean = 0.120, SEM = 0.007; and mutant n = 16, mean=0.151, SEM=0.006. Abbreviations: ch, ceratohyal; bsr, branchiostegal ray; de, dentary; en, entopterygoid; hs, hyosymplectic; ih, interhyal; m, Meckel’s cartilage; op, opercle; pq, palatoquadrate; q, quadrate. *p ≤ 0.05, **p ≤ 0.01, ***p ≤ 0.001. Scale bar = 100 microns. Cartilage is stained blue (Alcian Blue), bone is stained red (Alizarin Red). PHENOTYPE:
|
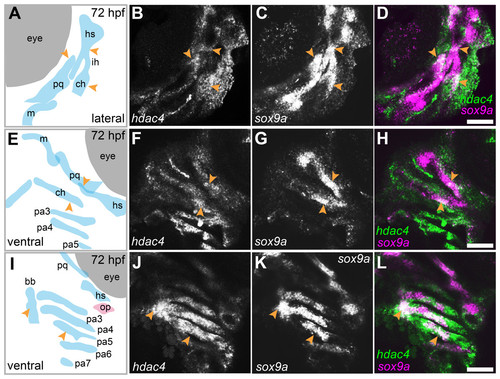
Expression of hdac4 and sox9a mRNA in the pharyngeal skeleton of wild-type embryos at 72 hpf, detected using mRNA in situ hybridization.(A) Schematic of skeletal elements, lateral view for B–D, blue indicates cartilage. (B–D) expression of hdac4 and sox9a, arrows indicate expression in hyosymplectic, ceratohyal, and palatoquadrate cartilages. (E) Schematic of skeletal elements, ventro-lateral view for F–H. (F–H) expression of hdac4 and sox9a, arrows indicate expression in ceratohyal and hyosymplectic cartilages. (I) Schematic of skeletal elements, blue indicates cartilage, red indicates bone, ventral view for J–L. (J–L) expression of hdac4 and sox9a, arrows indicate expression in the posterior pharyngeal arches. Abbreviations: bb, basibranchial; ch, ceratohyal; hs, hyosymplectic; ih, interhyal; m, Meckel’s cartilage; op, opercle; pa3-7, posterior pharyngeal arches 3-7; pq, palatoquadrate. Scale bar = 50 microns.EXPRESSION / LABELING:
|
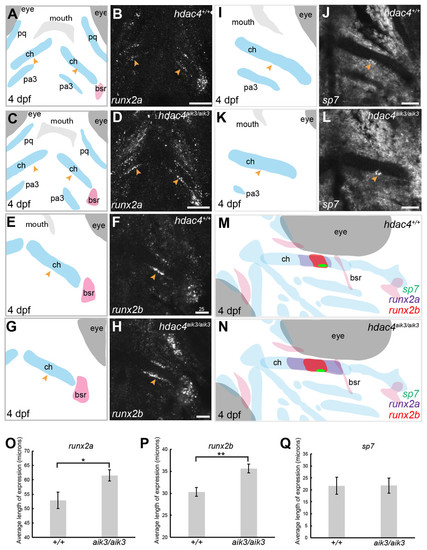
Expression of runx2a, runx2b, and sp7 mRNA in the pharyngeal skeleton of wild-type and mutant larvae at 4 dpf, detected using mRNA in situ hybridization using the hdac4aik3line.(A, C, E, G, I, K) Schematic views of skeletal elements, ventral view, blue indicates cartilage, red indicates bone. (B and D) expression of runx2a in wild-type (B) and mutant (D), arrows indicate expression at the posterior margin of the ceratohyal. (F and H) expression of runx2bin wild-type (F) and mutant (H), arrows indicate expression at the posterior margin of the ceratohyal. (J and L) expression of sp7 in wild-type (J) and mutant (L), arrows indicate expression at the posterior margin of the ceratohyal. M and N, schematic showing overlapping domains of expression of runx2a, runx2b, and sp7 in wild-type (M) and mutant (N) larvae. (O–Q) Average length of expression, bars in graph represent means and error bars are standard errors of means (SEM); runx2a (wild-type n = 10, mean = 52.9, SEM = 2.86; mutant n = 11, mean = 61.55, SEM = 1.95), runx2b (wild-type n = 8, mean = 30.33, SEM = 1.34; mutant n = 9, mean = 35.65, SEM = 0.82), sp7 (wild-type n = 12, mean = 21.73, SEM = 3.65; mutant n = 10, mean = 21.78, SEM = 3.15). Abbreviations: ch, ceratohyal; bsr, branchiostegal ray; pa3, pharyngeal arch 3; pq, palatoquadrate. *p ≤ 0.05, **p ≤ 0.01. B, D, scale bar = 50 microns, F, H, J, L, scale bar = 25 microns. Note that anterior and posterior lengths were at measured at different positions within the z-stack, and not all maximum lengths (anterior, posterior, right, and left ceratohyal) are represented in the sections shown in B, D, F, and H. |
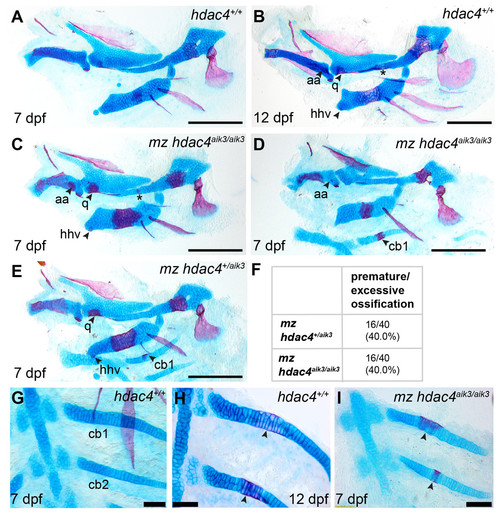
Analysis of maternal-zygote mutant and heterozygote cartilage ossification using specimens from the hdac4aik3 line, stained using Alcian Blue and Alizarin Red dyes.(A) Wild-type (non-sibling) larval pharyngeal skeleton at 7 dpf, lateral view. (B) Wild-type (non-sibling) larval pharyngeal skeleton at 12 dpf, lateral view. (C–E) maternal-zygotic mutant (C and D) and heterozygote (E) pharyngeal skeletons at 7 dpf showing premature ossification of the anguloarticular bone, ventral hypohyal, and ossification of the symplectic of the hyosymplectic (indicated by asterisk), lateral views. (F) Total scores of maternal-zygotic mutants and heterozygotes for premature/excessive ossification defects. (G and H) Wild-type posterior pharyngeal arches 3 and 4 at 7 dpf (G) and 12 dpf (H), including ossification of first and second ceratobranchial cartilages at 12 dpf, indicated by arrows, ventral views. (I) Maternal-zygotic mutant showing ossification of the first and second ceratobranchial cartilages cartilages at 7 dpf, indicated by arrows, ventral view. Abbreviations: aa, anguloarticular; cb1,2, ceratobranchial 1 and 2; q, quadrate; and hhv, ventral hypohyal. A–E, Scale bar = 200 microns, G–I, Scale bar = 50 microns. Cartilage is stained blue (Alcian Blue), bone is stained red (Alizarin Red). See Fig. 2A for schematic of the pharyngeal skeleton at 7 dpf. PHENOTYPE:
|
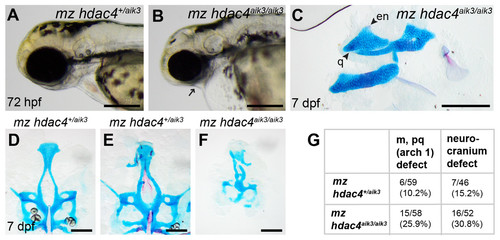
Analysis of maternal-zygote mutant and heterozygote first pharyngeal arch defects in fixed whole mount specimens and in specimens stained using Alcian Blue and Alizarin Red dyes.(A) Maternal mutant heterozygote larvae, 72 hpf, lateral view. (B) Maternal-zygotic mutant, 72 hpf, lateral view. Arrow indicates facial reduction. (C) Maternal-zygotic mutant pharyngeal skeleton showing loss of first pharyngeal arch elements (see Figs. 2A and 2D for reference), 7 dpf, lateral view. (D and E) Neurocrania of maternal mutant-zygotic heterozygote larvae showing normal patterning (D) and defects (E), 7 dpf, ventral views. (F) Neurocranium of maternal-zygotic mutant, 7 dpf, ventral view. (G) Total scores of maternal-zygotic mutants and heterozygotes for first pharyngeal arch skeletal defects and neurocranium defects. Abbreviations: en, entopterygoid; m, Meckel’s cartilage; pq, palatoquadrate; q, quadrate. Scale bar, 200 microns. Cartilage is stained blue (Alcian Blue), bone is stained red (Alizarin Red) PHENOTYPE:
|
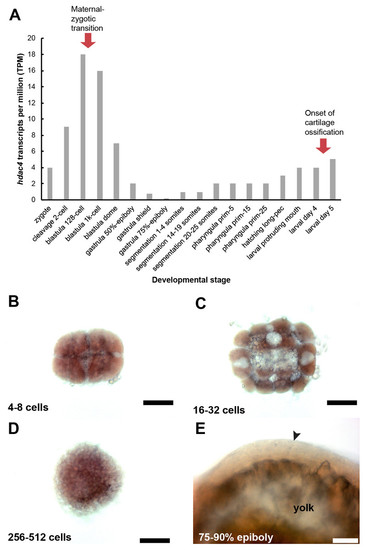
Expression of hdac4 mRNA transcripts at different stages of embryonic and larval development.A, RNA-seq mRNA levels of hdac4 transcripts from zygotic to larval day 5 stage. Bars indicate numbers of hdac4 transcripts per million transcripts at each stage. for Expression Atlas data. B, Expression of hdac4 mRNA at 4–8 cells, dorsal view. C, Expression of hdac4 mRNA at 16–32 cells, dorsal view. D, Expression of hdac4 mRNA at 256–512 cells, dorsal view. E, Expression of hdac4mRNA at 75–90% epiboly, arrow indicates embryo dorsal to the yolk sac, lateral view. B-D, Scale bar = 200 microns, E, Scale bar = 50 microns EXPRESSION / LABELING:
|

Unillustrated author statements PHENOTYPE:
|