
Image
|
Figure Caption
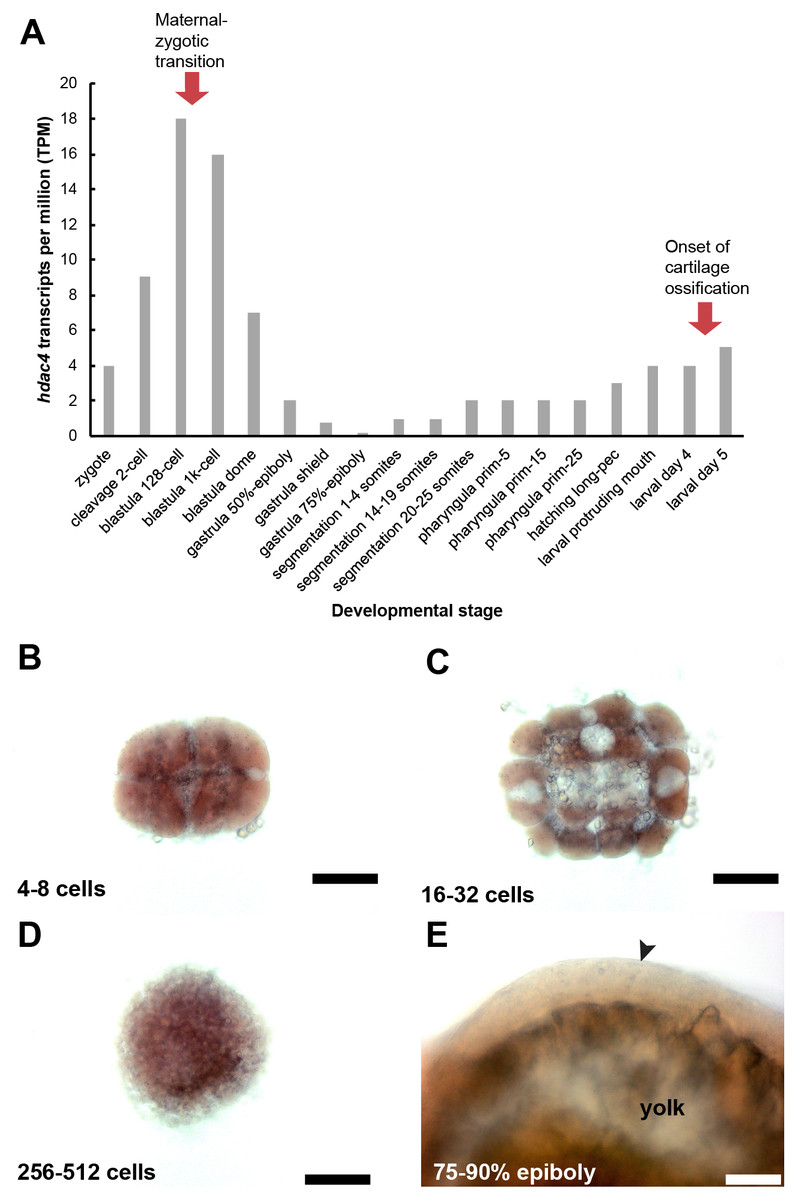
Fig. 7
Expression of hdac4 mRNA transcripts at different stages of embryonic and larval development.
A, RNA-seq mRNA levels of hdac4 transcripts from zygotic to larval day 5 stage. Bars indicate numbers of hdac4 transcripts per million transcripts at each stage. for Expression Atlas data. B, Expression of hdac4 mRNA at 4–8 cells, dorsal view. C, Expression of hdac4 mRNA at 16–32 cells, dorsal view. D, Expression of hdac4 mRNA at 256–512 cells, dorsal view. E, Expression of hdac4mRNA at 75–90% epiboly, arrow indicates embryo dorsal to the yolk sac, lateral view. B-D, Scale bar = 200 microns, E, Scale bar = 50 microns
Figure Data
Acknowledgments
This image is the copyrighted work of the attributed author or publisher, and
ZFIN has permission only to display this image to its users.
Additional permissions should be obtained from the applicable author or publisher of the image.
Full text @ Peer J.