
- Title
-
Live imaging of leukocyte recruitment in a zebrafish model of chemical liver injury
- Authors
- Stoddard, M., Huang, C., Enyedi, B., Niethammer, P.
- Source
- Full text @ Sci. Rep.
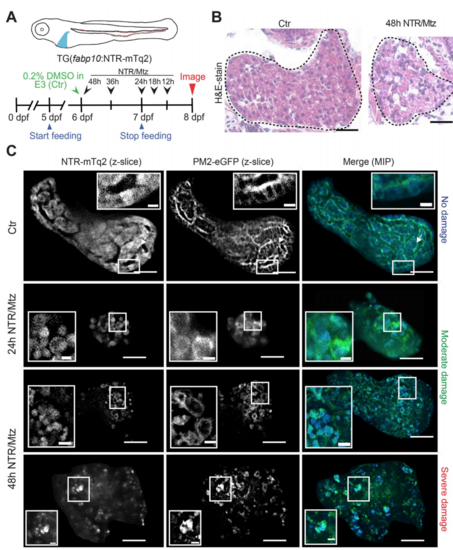
The NTR/Mtz system induces selective liver damage in larval zebrafish. (A) Upper panel, cartoon of transgenic larva expressing cyan fluorescent NTR fusion protein in the liver. Lower panel, scheme of experimental timeline. Black arrows/numbers indicate how long fish were bathed in 5 mM Mtz or DMSO carrier prior to live imaging. Blue arrows indicate time window of larval feeding. Feeding was stopped one day prior to imaging to reduce autofluorescence. (B) Haemotoxylin & Eosin (H&E) staining of 8 dpf TG(fabp10:NTR-mTq2; casper) larvae exposed to 0.2% DMSO (Ctr) or 5 mM Mtz (48 h NTR/Mtz). The “Ctr” image is representative for the H&E staining pattern in 4 of 5 larvae. The “48 h NTR/Mtz” image is representative for the H&E staining pattern in 3 of 4 larvae. Dashed line, liver outlines. Scale bars, 50 μm. (C) TG(fabp10:NTR-mTq2; fabp10:PM2-eGFP-P2A-mTq2-NES) larvae reveal morphological abnormalities after Mtz exposure. Representative confocal z-slices of hepatocyte cytoplasm (NTR-mTq2, cyan fluorescence, left column) or plasma membranes (PM2-eGFP, green fluorescence, middle column) highlight liver morphology. Maximum intensity projections (MIP, right column) of confocal z-slices show overall liver shape and morphology in both channels. Scale bars, 50 µm. Top row: No/Mild damage in control. Insets, regularly arranged hepatocytes with distinct cell boundaries are in close contact. Inset scale bars, 10 μm. Middle rows: Moderate damage in larvae exposed to Mtz for either 24 h (second row) or 48 h (third row). Inset, rounded hepatocytes that have lost close cell-cell contact. Inset scale bars, 10 μm. Bottom row: Severely damaged liver in larva treated with Mtz for 48 h. Insets, severely disturbed hepatocyte morphology. Scale bars, 10 μm. |
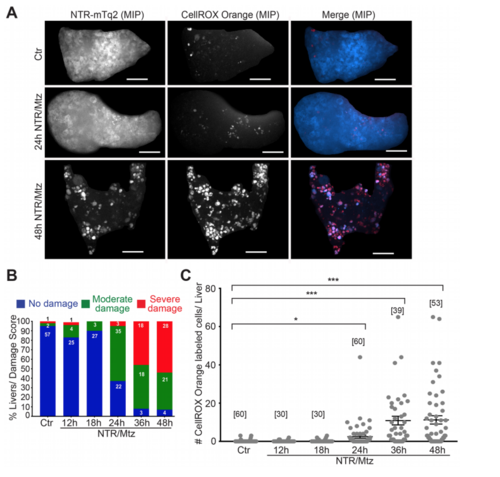
NTR/Mtz-induced liver damage is associated with oxidative stress. (A) Representative maximum intensity projections (MIP) of 8 dpf TG(fabp10:NTR-mTq2; casper) zebrafish livers exposed to Mtz for 24 h or 48 h. Cyan, NTR-mTq2. Red, CellROX oxidative stress dye. Scale bars, 50 µm (B) Quantification of morphological phenotypes by damage score. Numbers within bars indicate number of animals per group. (C) Quantification of CellROX live stain. Square brackets, number of animals per condition. Error bars, SEM. *t-test p < 0.05. ***t-test p < 0.0005. PHENOTYPE:
|
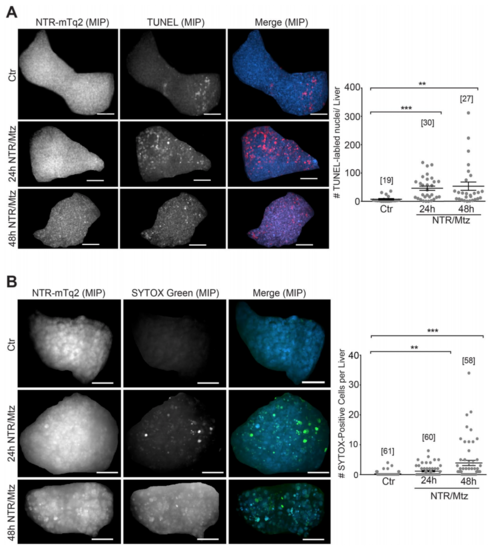
NTR/Mtz primarily induces apoptosis and sporadic necrosis. (A) Left panel: Representative maximum intensity projections (MIP) of zebrafish livers stained for apoptotic DNA (TUNEL) after 24 h and 48 h of Mtz exposure. Cyan, NTR-mTq2. Red, TUNEL labeling. Scale bars, 50 μm. Right panel: Quantification of TUNEL staining. Square brackets, number of animals per condition. Error bars, SEM. **t-test p < 0.005. ***t-test p < 0.0005. (B) Left Panel: Representative confocal maximum intensity projections (MIP) of livers stained for necrotic cells with SYTOX Green after 24 h and 48 h of Mtz exposure. Cyan, NTR-mTq2. Green, SYTOX Green. Scale bars, 50 µm. Right Panel: Quantification of SYTOX Green staining. Square brackets, number of animals per condition. Error bars, SEM. **t-test p < 0.005. ***t-test p < 0.0005. PHENOTYPE:
|

ZFIN is incorporating published figure images and captions as part of an ongoing project. Figures from some publications have not yet been curated, or are not available for display because of copyright restrictions. |
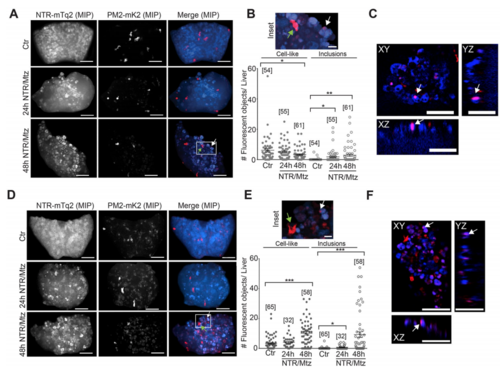
Neutrophil recruitment after Mtz-induced liver damage. (A) Representative confocal maximum intensity projections (MIP) of zebrafish livers with fluorescent neutrophils after indicated times of Mtz exposure in the lysC neutrophil reporter line. Green arrow, intact neutrophil. White arrow, red fluorescent inclusion. White box marks the inset region. Scale bars, 50 μm. (B) Top: Inset, magnification of marked region in A. Scale bar, 10 μm. Bottom Left: Quantification of lysC neutrophils in the liver at indicated times of Mtz exposure in the lysC:PM2-mK2 reporter line. Bottom Right: Quantification of red fluorescent inclusions in the TG(lysC:PM2-mK2) reporter line. Square brackets, number of animals per condition. Error bars, SEM. *t-test < 0.05. **t-test < 0.005. (C) Orthogonal slice view of TG(lysC:PM2-mK2) larval livers exposed to Mtz for 24 hours. White arrows, red fluorescent inclusions overlapping with hepatocyte. Scale bars, 50 μm. (D) Representative confocal maximum intensity projections (MIP) of zebrafish livers with fluorescent neutrophils after indicated times of Mtz exposure in the TG(mpx:PM2-mK2) reporter line. Green arrow, intact neutrophil. White arrow, red fluorescent inclusions. White box marks the inset region. Scale bars, 50 μm. (E) Top: Magnification of marked region in D. Green arrow, intact neutrophil. White arrow, red fluorescent inclusions. Scale bar, 10 μm. Bottom Left: number of neutrophils in the liver at indicated times of Mtz exposure in the mpx neutrophil reporter line. Bottom Right: number of red fluorescent inclusions in the mpx neutrophil reporter line. Square brackets, number of animals per condition. Error bars, SEM. *t-test p < 0.05. ***t-test p < 0.0005. (F) Orthogonal slice view of lysC neutrophil reporter larvae exposed to Mtz for 48 hours. White arrows, red fluorescent inclusion. Scale bars, 50 μm. PHENOTYPE:
|
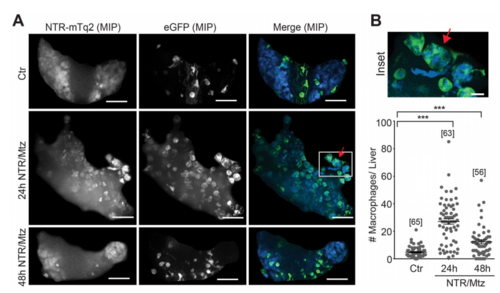
Macrophage recruitment after Mtz-induced liver damage. (A) Representative confocal maximum intensity projections (MIP) of zebrafish livers with fluorescent macrophages after indicated times of Mtz exposure in the mpeg1 macrophage reporter line. Red arrow, rounded hepatocyte appears to be engulfed by a macrophage. White box, marks the inset region. Scale bars, 50 μm. (B) Top: Magnification of marked region in A. Scale bar, 10 μm. Bottom: Number of macrophages in the liver at indicated times of Mtz exposure in the mpeg1macrophage reporter line. Square brackets, number of animals per condition. Error bars, SEM. ***t-test p < 0.0005. |