
Image
|
Figure Caption
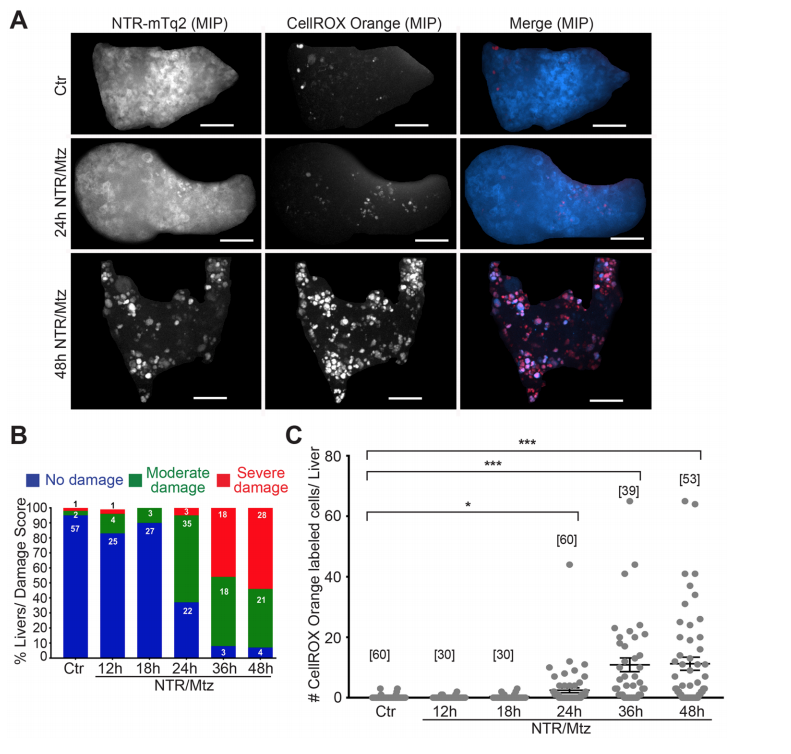
Fig. 2
NTR/Mtz-induced liver damage is associated with oxidative stress. (A) Representative maximum intensity projections (MIP) of 8 dpf TG(fabp10:NTR-mTq2; casper) zebrafish livers exposed to Mtz for 24 h or 48 h. Cyan, NTR-mTq2. Red, CellROX oxidative stress dye. Scale bars, 50 µm (B) Quantification of morphological phenotypes by damage score. Numbers within bars indicate number of animals per group. (C) Quantification of CellROX live stain. Square brackets, number of animals per condition. Error bars, SEM. *t-test p < 0.05. ***t-test p < 0.0005.
Figure Data
Acknowledgments
This image is the copyrighted work of the attributed author or publisher, and
ZFIN has permission only to display this image to its users.
Additional permissions should be obtained from the applicable author or publisher of the image.
Full text @ Sci. Rep.