
- Title
-
Cumulative mitochondrial activity correlates with ototoxin susceptibility in zebrafish mechanosensory hair cells
- Authors
- Pickett, S.B., Thomas, E.D., Sebe, J.Y., Linbo, T., Esterberg, R., Hailey, D.W., Raible, D.W.
- Source
- Full text @ Elife
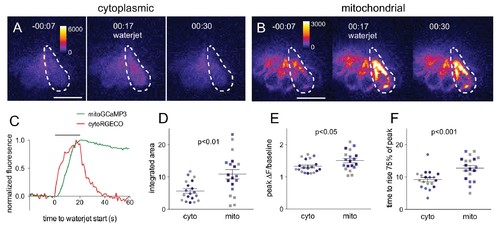
Mitochondrial Ca2+ increases in response to hair cell stimulation.Frames from a time-lapse calcium imaging video acquired from Tg[myo6b:RGECO]vo10Tg fish (A) and Tg[myo6b:mitoGCaMP3]w119 fish (B) during waterjet stimulation at 10 Hz. For each condition, fluorescence is shown before, during, and after stimulation (left, middle, right, respectively). (C) Normalized fluorescence of the example cell outlined by the dotted line in A and B. Hair cells were imaged from a lateral view, as indicated in the schematic shown in Figure 1—figure supplement 1A. Summary data of the integrated area (D), peak fluorescence (E), and rise time (F) for the cytoplasmic and mitochondrial calcium signal. Colored points indicate matched values from the same experiment. Values for (D): cyto vs. mito: 5.6 ± 0.7 vs 11 ± 1.3; mean ± SE; n = 19 cells; (E): cyto vs. mito: 1.3 ± 0.04 vs 1.5 ± 0.06; mean ± SE; n = 21 cells; (F): cyto vs. mito: 8.9 ± 0.7 s vs 13 ± 0.9 s; mean ± SE; n = 19 vs 21 cells. Cells were analyzed from 10 different fish across three different experiments. Two-tailed unpaired Student’s t test was used to assess significance. Scale bar = 10 μm. |
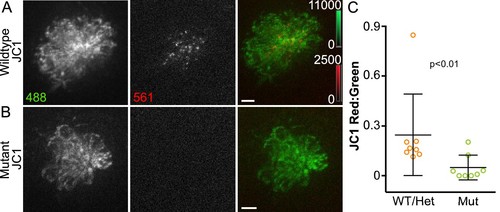
Acute mitochondrial activity is reduced in the absence of MET.(A, B) Maximum projections of hair cells from WT/Het and sputnik mutant siblings incubated in JC-1 dye. Hair cells were imaged from a dorsal view, as indicated in the schematic shown in Figure 1—figure supplement 1B. (C) Mean JC-1 fluorescence plotted as a ratio of red:green. WT/Het: 0.25 ± 0.24 n = 8 fish; Mutant: 0.05 ± 0.07 n = 8 fish; mean ratio ± SD. Mann-Whitney U test was used to assess significance. Value for each fish represents the mean of 3 neuromasts. Scale bar = 5 μm. |
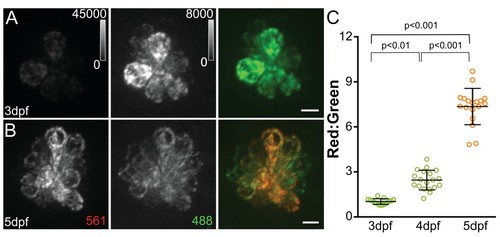
MitoTimer fluorescence ratio increases with neuromast maturation.Maximum projections of hair cells from Tg[myo6b:mitoTimer]w208 fish at 3dpf (A) and 5dpf (B). (C) Mean mitoTimer fluorescence plotted as ratio of red:green at 3, 4, and 5dpf. 3dpf: 1.03 ± 0.05, 4dpf: 2.47 ± 0.66, 5dpf: 7.58 ± 1.2; mean ratio ±SD; n = 15–18 fish. Significance was analyzed by Kruskal-Wallis test with Dunn’s post-test. Value for each fish represents the mean of 2–3 neuromasts. Scale bar = 5 μm. EXPRESSION / LABELING:
|
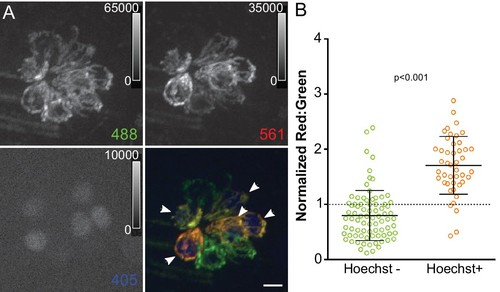
Mitochondrial oxidation corresponds with hair cell age and mechanotransduction activity.(A) Maximum projection of mitoTimer expressing hair cells co-labeled with Hoechst. Hair cells were imaged at 4dpf, 24 hr after Hoechst treatment. Arrowheads mark Hoechst-positive cells. (B) mitoTimer fluorescence ratio for cells that are positive for Hoechst staining compared to Hoechst negative cells. mitoTimer ratios are normalized to the median, which is indicated by the dotted line. Hoechst positive: 1.71 ± 0.52, n = 45 cells; Hoechst negative: 0.80 ± 0.45, n = 80 cells; mean ratio (normalized) ±SD; five fish, three neuromasts per fish. Mann-Whitney U test was used to assess significance. Scale bar = 5 μm. EXPRESSION / LABELING:
|
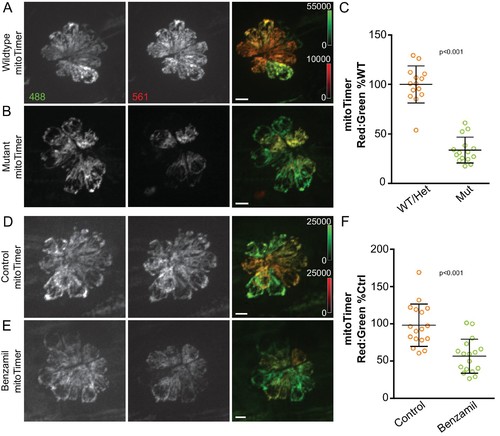
Mitochondrial activity depends on hair cell mechanotransduction.(A, B) Maximum projections of hair cells from WT/Het and sputnik mutant siblings crossed to Tg[myo6b:mitoTimer]w208. (C) mitoTimer mean fluorescence ratio for WT/Het and sputnik larvae. WT/Het: 100 ± 18.7, n = 14 fish; Mutant: 34 ± 13.1,15 mutant fish; mean (% WT/Het)±SD. Value for each fish represents the mean of 2–4 neuromasts. (D, E) Maximum projections of mitoTimer-expressing hair cells from control larvae and larvae incubated in 200 μM benzamil. (F) mitoTimer mean fluorescence ratio for larvae incubated in benzamil compared to DMSO control. Control: 100 ± 28.7; Treated: 56.6 ± 22.7, n = 17 fish per group; mean (% Control)±SD. Value for each fish represents the mean of 2–4 neuromasts. Mann-Whitney U test was used to assess significance. All larvae imaged at 5dpf. Scale bar = 5 μm. |
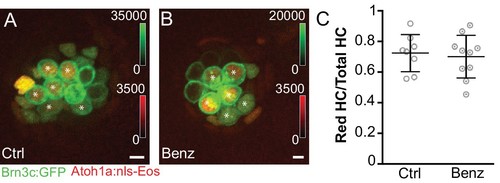
Reduced hair cell activity does not influence hair cell turnover.Maximum projects of (A) DMSO control and (B) benzamil-treated fish expressing hair cell-specific membrane GFP (Tg[Pou4f3:gap43-GFP]) and photoconverted, nuclear localized EOS (Tg[Atoh1a:nls-Eos]w214) at 5dpf. (C) The ratio of red label-retaining hair cells to total number of hair cells per neuromast counted at 5dpf. There is no difference between control and treated groups, indicating that reduced MET does not lead to increased hair cell turnover. Control: 0.72 ± 0.12, n = 8 control fish; Treated: 0.70 ± 0.14, mean ratio ±SD, n = 10 fish; 2–3 neuromasts analyzed per fish; Mann-Whitney U test, p = 0.76. Asterisks indicate hair cells with label-retaining nuclei. Scale bar = 5 μm. EXPRESSION / LABELING:
|
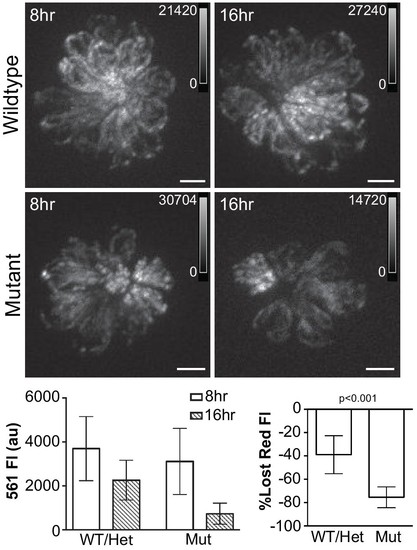
Hair cell activity influences mitochondrial turnover.(A, B) Maximum projections of mitoEos red fluorescence 8 and 16 hr after photoconversion in wildtype and sputnik fish crossed to Tg[myo6b:mitoEos]w207. (C) Mean red fluorescence decreases over time in both wildtype and mutant fish. WT/Het: 8 hr, 3696 ± 1083; 16 hr, 2257 ± 604; Mutant: 8 hr, 2942 ± 878; 16 hr, 721 ± 262, mean ± SD. (D) The loss of red fluorescence is significantly greater in mutant animals. WT/Het: 38.9 ± 16.4; Mutant: 75.5 ± 8.9; mean (% lost)±SD. n = 9 fish per group. Value for each fish represents the mean of 3 neuromasts. Significance analyzed by Mann-Whitney U test. Scale bar = 5 μm. |
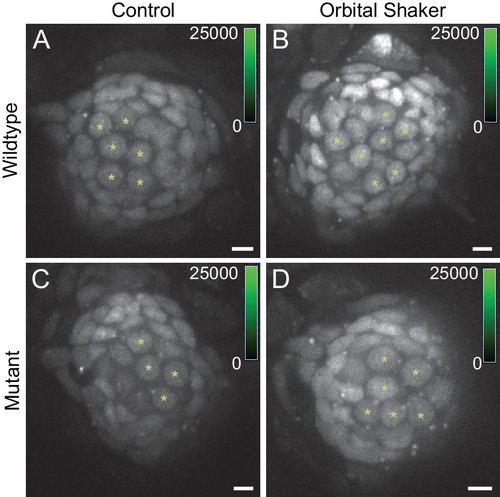
Hair cell oxidation increases with sustained stimulation via orbital shaking.(A,C) CellROX green fluorescence labeling in WT/Het and sputnik mutants in the no-shaker control condition. (B,D) CellROX green fluorescence in WT/Het and sputnik mutants after 24 hr of orbital shaking. CellROX green labels hair cell and support cell nuclei. Asterisks indicate hair cells, identified based on nuclear shape and location. Scale bar = 5 μm. |
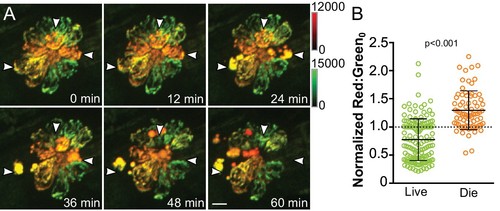
Cumulative mitochondrial activity reflects the likelihood of hair cell death following neomycin-induced damage.(A) Frames from a time-lapse imaging video acquired from Tg[myo6b:mitoTimer]w208 fish treated with 50 μM neomycin. Images are maximum projections. Arrowheads indicate dying cells. (B) Baseline mitoTimer fluorescence ratio for living and dying cells following neomycin exposure. mitoTimer ratios are normalized to the median, which is indicated by the dotted line. Live: 0.77 ± 0.37, n = 142 cells; Die: 1.30 ± 0.34, n = 74 cells; mean ratio (normalized) ±SD; six fish, 2–3 neuromasts per fish. Mann-Whitney U test was used to assess significance. Scale bar = 5 μm.
|