
Fig. 1
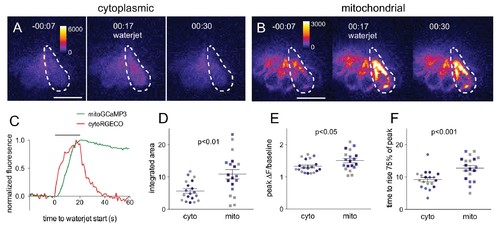
Mitochondrial Ca2+ increases in response to hair cell stimulation.Frames from a time-lapse calcium imaging video acquired from Tg[myo6b:RGECO]vo10Tg fish (A) and Tg[myo6b:mitoGCaMP3]w119 fish (B) during waterjet stimulation at 10 Hz. For each condition, fluorescence is shown before, during, and after stimulation (left, middle, right, respectively). (C) Normalized fluorescence of the example cell outlined by the dotted line in A and B. Hair cells were imaged from a lateral view, as indicated in the schematic shown in Figure 1—figure supplement 1A. Summary data of the integrated area (D), peak fluorescence (E), and rise time (F) for the cytoplasmic and mitochondrial calcium signal. Colored points indicate matched values from the same experiment. Values for (D): cyto vs. mito: 5.6 ± 0.7 vs 11 ± 1.3; mean ± SE; n = 19 cells; (E): cyto vs. mito: 1.3 ± 0.04 vs 1.5 ± 0.06; mean ± SE; n = 21 cells; (F): cyto vs. mito: 8.9 ± 0.7 s vs 13 ± 0.9 s; mean ± SE; n = 19 vs 21 cells. Cells were analyzed from 10 different fish across three different experiments. Two-tailed unpaired Student’s t test was used to assess significance. Scale bar = 10 μm. |
| Genes: | |
|---|---|
| Fish: | |
| Anatomical Terms: | |
| Stage Range: | Day 5 to Days 7-13 |