
|
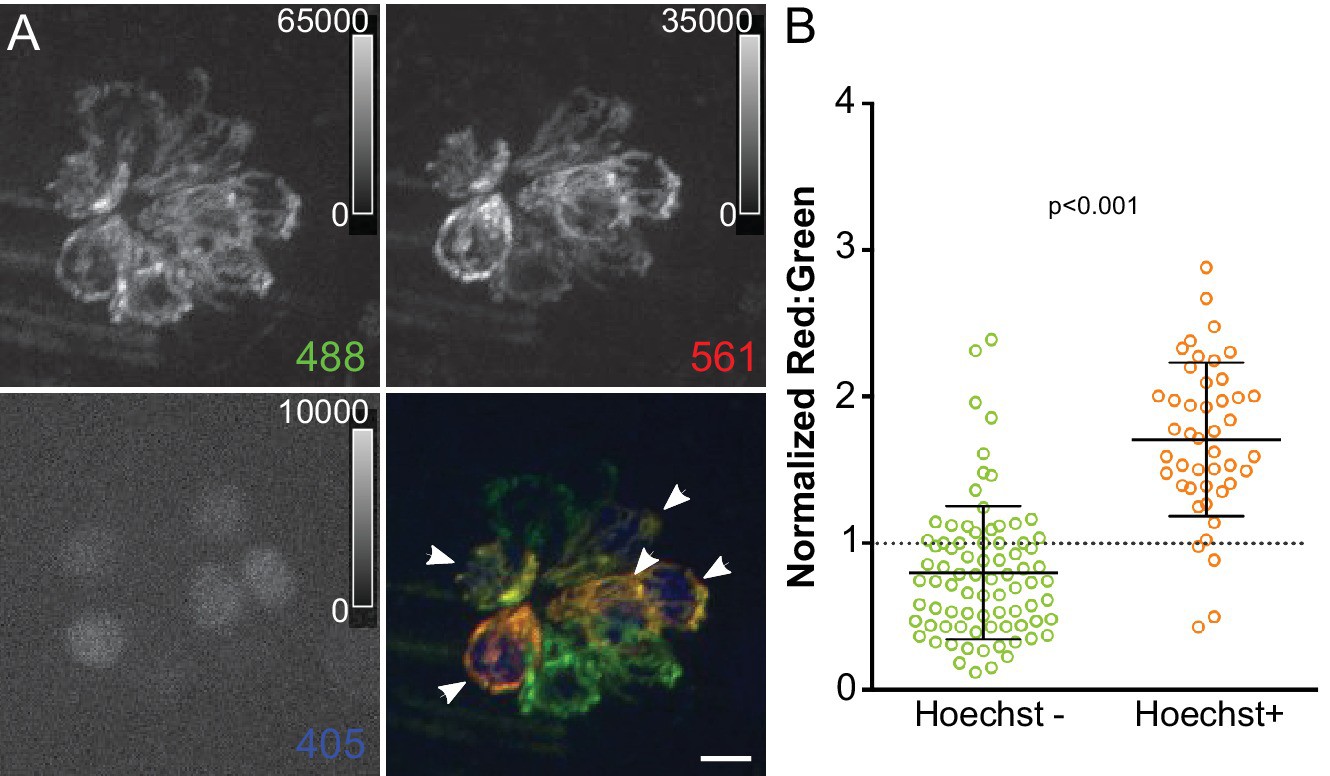
Fig. 4
Mitochondrial oxidation corresponds with hair cell age and mechanotransduction activity.
(A) Maximum projection of mitoTimer expressing hair cells co-labeled with Hoechst. Hair cells were imaged at 4dpf, 24 hr after Hoechst treatment. Arrowheads mark Hoechst-positive cells. (B) mitoTimer fluorescence ratio for cells that are positive for Hoechst staining compared to Hoechst negative cells. mitoTimer ratios are normalized to the median, which is indicated by the dotted line. Hoechst positive: 1.71 ± 0.52, n = 45 cells; Hoechst negative: 0.80 ± 0.45, n = 80 cells; mean ratio (normalized) ±SD; five fish, three neuromasts per fish. Mann-Whitney U test was used to assess significance. Scale bar = 5 μm.