
- Title
-
Data on ultrabright fluorescent cellulose acetate nanoparticles for imaging tumors through systemic and topical applications
- Authors
- Peng, B., Almeqdadi, M., Laroche, F., Palantavida, S., Dokukin, M., Roper, J., Yilmaz, O.H., Feng, H., Sokolov, I.
- Source
- Full text @ Data Brief
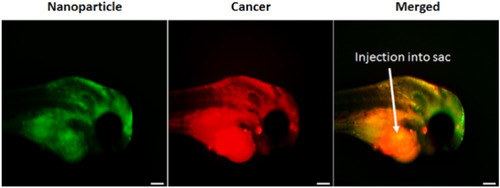
Fluorescence images of nanoparticle, cancer cell, and merged particle-cancer channels within the zebrafish head. Cervical cancer cells/metastases and targeted nanoparticles were both injected into the sac directly behind the eye. Scale bar is 100 µm.
|
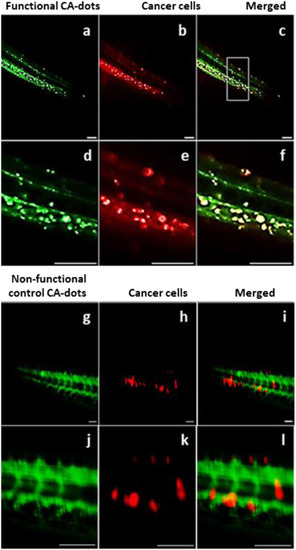
Localization of CA-SB-PEG-FA (a,d) nanoparticles and cancer cells (b,e) in zebrafish 30 min following injection. Particle-cancer cell colocalization (c,f) can be seen as yellow color after merging of green and red channels. The top panel shows the full zebrafish tail. The bottom panel is a zoomed section demonstrating clear evidence of cancer targeting. Localization of CA-SB-PEG (a,d) nanoparticles and cancer cells (b,e) in zebrafish 30 min following injection. Ideally, particle-cancer cell colocalization (c,f) can be seen as yellow color after merging of green and red channels. The top panel (a-c) shows the full zebrafish tail while the bottom panel (d-f) is a zoomed section demonstrating little evidence of cancer targeting. Scale bar is 100 μm.
|
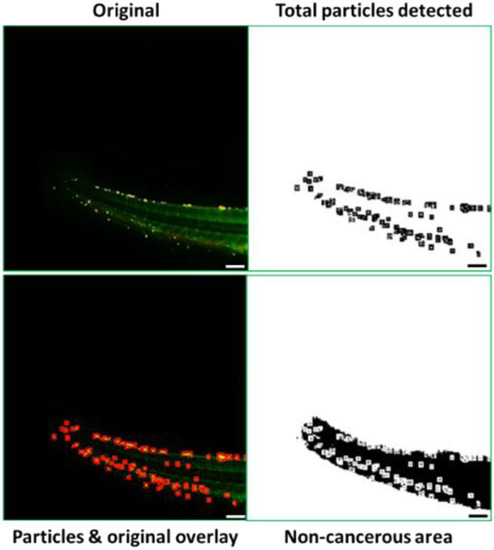
Sensitivity-Specificity analysis was performed on the 50 min merged fluorescence image of folate-functionalized nanoparticles. Scale bar is 100 μm.
|
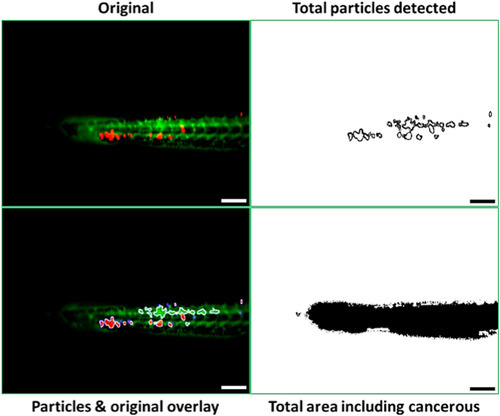
Sensitivity-Specificity analysis was performed on the 50 min merged fluorescence image of control PEGylated nanoparticles. Scale bar is 100 μm.
|