
FIGURE
Fig. 8
- ID
- ZDB-FIG-190522-9
- Publication
- Peng et al., 2018 - Data on ultrabright fluorescent cellulose acetate nanoparticles for imaging tumors through systemic and topical applications
- Other Figures
- All Figure Page
- Back to All Figure Page
Fig. 8
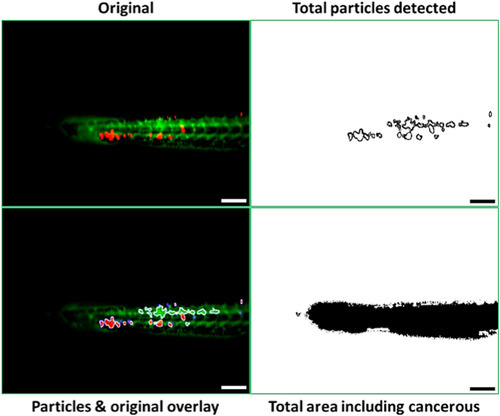
Sensitivity-Specificity analysis was performed on the 50 min merged fluorescence image of control PEGylated nanoparticles. Scale bar is 100 μm.
|
Expression Data
Expression Detail
Antibody Labeling
Phenotype Data
Phenotype Detail
Acknowledgments
This image is the copyrighted work of the attributed author or publisher, and
ZFIN has permission only to display this image to its users.
Additional permissions should be obtained from the applicable author or publisher of the image.
Full text @ Data Brief