
|
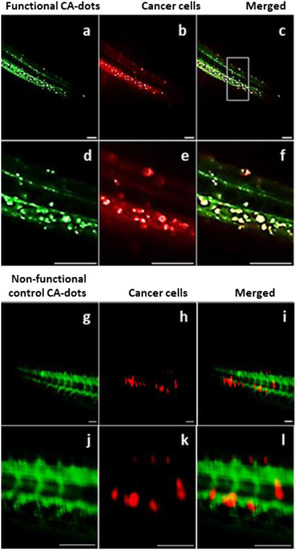
Fig. 6
Localization of CA-SB-PEG-FA (a,d) nanoparticles and cancer cells (b,e) in zebrafish 30 min following injection. Particle-cancer cell colocalization (c,f) can be seen as yellow color after merging of green and red channels. The top panel shows the full zebrafish tail. The bottom panel is a zoomed section demonstrating clear evidence of cancer targeting. Localization of CA-SB-PEG (a,d) nanoparticles and cancer cells (b,e) in zebrafish 30 min following injection. Ideally, particle-cancer cell colocalization (c,f) can be seen as yellow color after merging of green and red channels. The top panel (a-c) shows the full zebrafish tail while the bottom panel (d-f) is a zoomed section demonstrating little evidence of cancer targeting. Scale bar is 100 μm.