
- Title
-
The afc antifungal activity cluster, which is under tight regulatory control of ShvR, is essential for transition from intracellular persistence of Burkholderia cenocepacia to acute pro-inflammatory infection
- Authors
- Gomes, M.C., Tasrini, Y., Subramoni, S., Agnoli, K., Feliciano, J.R., Eberl, L., Sokol, P., O'Callaghan, D., Vergunst, A.C.
- Source
- Full text @ PLoS Pathog.

ZFIN is incorporating published figure images and captions as part of an ongoing project. Figures from some publications have not yet been curated, or are not available for display because of copyright restrictions. PHENOTYPE:
|
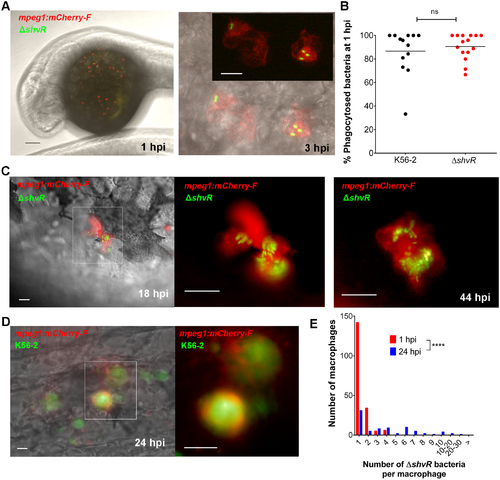
ΔshvR mutant bacteria are able to persist and replicate in macrophages. (A) Tg(mpeg1:mCherry-F) embryos were injected intravenously at 30 h post fertilization with ~50 CFU ΔshvR bacteria expressing eGFP (pIN301). Left panel: Confocal stack image over the yolk region of a representative embryo (macrophages marked in red) at 1 hpi. Scale bar 100 μm. Right panel: Detailed confocal (bright field and fluorescent overlay) image stack of two macrophages at 3 hpi containing 2 and 3 ΔshvR bacteria, respectively. Inset shows red and green channels only. Scale bar 10 μm. S1 Movie shows a video of the individual (21) sequential images. (B) Quantification of intracellular and extracellular bacteria in PFA-fixed embryos at 1 hpi over the yolk as indicated in Fig 2A using confocal microscopy. Each data point represents an individual Tg(mpeg1:mCherry-F) transgenic embryo injected intravenously with either wildtype B. cenocepacia K56-2 (black dots, n = 13) or ΔshvR (red dots, n = 15) expressing eGFP. Counts per embryo are presented as percentage of internalized bacteria relative to total numbers of bacteria in the yolk sac region. A total of 220 and 141 bacteria were counted for K56-2 and ΔshvR, respectively. Unpaired t-test, with mean 86.7 ± 5.3 and 90.6 ± 2.8, respectively, p-value 0.51. Data in (A, B) are representative of two independent experiments. (C) Tg(mpeg1:mCherry-F) embryos were injected with ΔshvR expressing eGFP. Images of an infected macrophage at 18 hpi over the yolk (left, bright field and fluorescent overlay image; enlarged inset, red and green overlay) and at 44 hpi (red and green overlay image) with high numbers of intracellular bacteria (representative of at least 5 embryos per treatment in more than 3 experiments). Scale bars, 12.5 μm. (D) Tg(mpeg1:mCherry-F) embryos were injected with K56-2 wildtype expressing eGFP. Image of an infection site at 24 hpi in the tail region (left, bright field and fluorescent overlay image; enlarged inset, red and green overlay) with high numbers of bacteria. Scale bars, 12.5 μm. (E) Quantification of the number of intracellular ΔshvR bacteria per macrophage in PFA-fixed embryos at 1 hpi (mean: 1.3 ± 0.05 bacteria per macrophage) and 24 hpi (4.1 ± 0.47 SEM), presented as frequency distribution histogram. The graph represents a total of 187 (15 embryos) and 80 macrophages (10 embryos), at 1 and 24 hpi respectively. Mann Whitney test p < 0.0001. Representative of 2 experiments. |
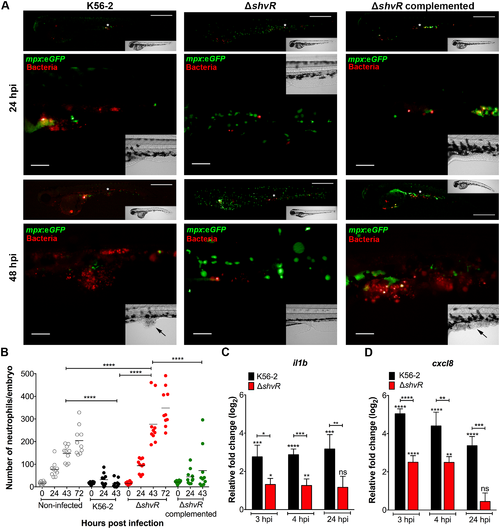
A ΔshvR mutant is unable to spread and elicit strong pro-inflammatory responses. B. cenocepacia K56-2, ΔshvR, and complemented ΔshvR were microinjected intravenously in embryos at 30 hpf. (A) Real time imaging of representative Tg(mpx:eGFP) injected larvae (neutrophils green) with fluorescent bacteria (red filter) at 24 and 48 hpi. For each bacterial strain, the same embryo was imaged at both time points. White asterisks in upper images indicate the region imaged with a higher magnification objective and presented underneath. Black arrows in bright field inset indicate tissue damage. Scale bar, 50 μm. (B) Mean neutrophil numbers in Tg(mpx:eGFP) larvae of non-infected control (grey open circles) and infected with K56-2 (black circles), ΔshvR (red circles) and complemented mutant (green circles). Representative images of each group, and an example of a binary conversion image used for pixel quantification are provided in S1 Fig. Quantification was performed prior to injection (0 hpi) and at 24 and 48 hpi. Only in non-infected and ΔshvR-infected embryos the 72 hpi time points were considered as embryos were still alive. Geometric means with each data point representing an individual embryo. Pooled results from two independent experiments are shown (n = 5 respectively per group per experiment). Significance was determined using one-way ANOVA with Sidak’s Multiple Comparisons test. (C, D) Mean relative il1b and cxcl8 gene expression levels (qRT-PCR) in embryos injected with on average 273 ± 114 CFU of B. cenocepacia K56-2 (black bars) or 184 ± 111 CFU of ΔshvR (red bars). Normalization was performed to the PBS-injected control group at each time point. Asterisks above each bar indicate significance compared to the PBS control at each time point, and significance between groups per time point is indicated with a horizontal line. Error bars represent mean with SEM of three independent experiments. Statistical analysis of qRT-PCR data was performed using one-way ANOVA with Tukey’s Multiple Comparison Test. (B, C, D) * p ≤ 0.05, ** p ≤ 0.01, *** p ≤ 0.001, **** p ≤ 0.0001, ns: not significant. |