
Fig. 3
- ID
- ZDB-FIG-190426-15
- Publication
- Gomes et al., 2018 - The afc antifungal activity cluster, which is under tight regulatory control of ShvR, is essential for transition from intracellular persistence of Burkholderia cenocepacia to acute pro-inflammatory infection
- Other Figures
- All Figure Page
- Back to All Figure Page
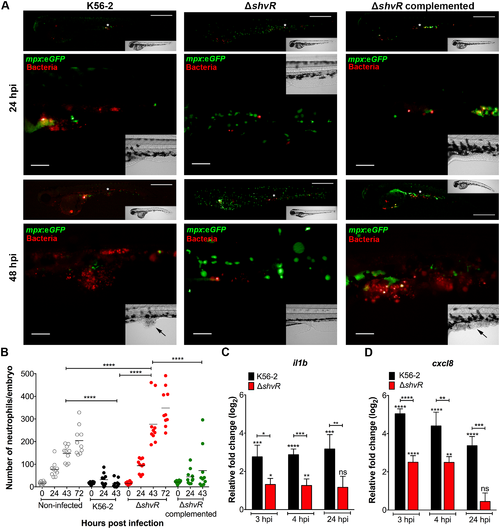
A ΔshvR mutant is unable to spread and elicit strong pro-inflammatory responses. B. cenocepacia K56-2, ΔshvR, and complemented ΔshvR were microinjected intravenously in embryos at 30 hpf. (A) Real time imaging of representative Tg(mpx:eGFP) injected larvae (neutrophils green) with fluorescent bacteria (red filter) at 24 and 48 hpi. For each bacterial strain, the same embryo was imaged at both time points. White asterisks in upper images indicate the region imaged with a higher magnification objective and presented underneath. Black arrows in bright field inset indicate tissue damage. Scale bar, 50 μm. (B) Mean neutrophil numbers in Tg(mpx:eGFP) larvae of non-infected control (grey open circles) and infected with K56-2 (black circles), ΔshvR (red circles) and complemented mutant (green circles). Representative images of each group, and an example of a binary conversion image used for pixel quantification are provided in S1 Fig. Quantification was performed prior to injection (0 hpi) and at 24 and 48 hpi. Only in non-infected and ΔshvR-infected embryos the 72 hpi time points were considered as embryos were still alive. Geometric means with each data point representing an individual embryo. Pooled results from two independent experiments are shown (n = 5 respectively per group per experiment). Significance was determined using one-way ANOVA with Sidak’s Multiple Comparisons test. (C, D) Mean relative il1b and cxcl8 gene expression levels (qRT-PCR) in embryos injected with on average 273 ± 114 CFU of B. cenocepacia K56-2 (black bars) or 184 ± 111 CFU of ΔshvR (red bars). Normalization was performed to the PBS-injected control group at each time point. Asterisks above each bar indicate significance compared to the PBS control at each time point, and significance between groups per time point is indicated with a horizontal line. Error bars represent mean with SEM of three independent experiments. Statistical analysis of qRT-PCR data was performed using one-way ANOVA with Tukey’s Multiple Comparison Test. (B, C, D) * p ≤ 0.05, ** p ≤ 0.01, *** p ≤ 0.001, **** p ≤ 0.0001, ns: not significant. |