
Fig. 2
- ID
- ZDB-IMAGE-190426-11
- Publication
- Gomes et al., 2018 - The afc antifungal activity cluster, which is under tight regulatory control of ShvR, is essential for transition from intracellular persistence of Burkholderia cenocepacia to acute pro-inflammatory infection
- All Figures
- Figures for Gomes et al., 2018
|
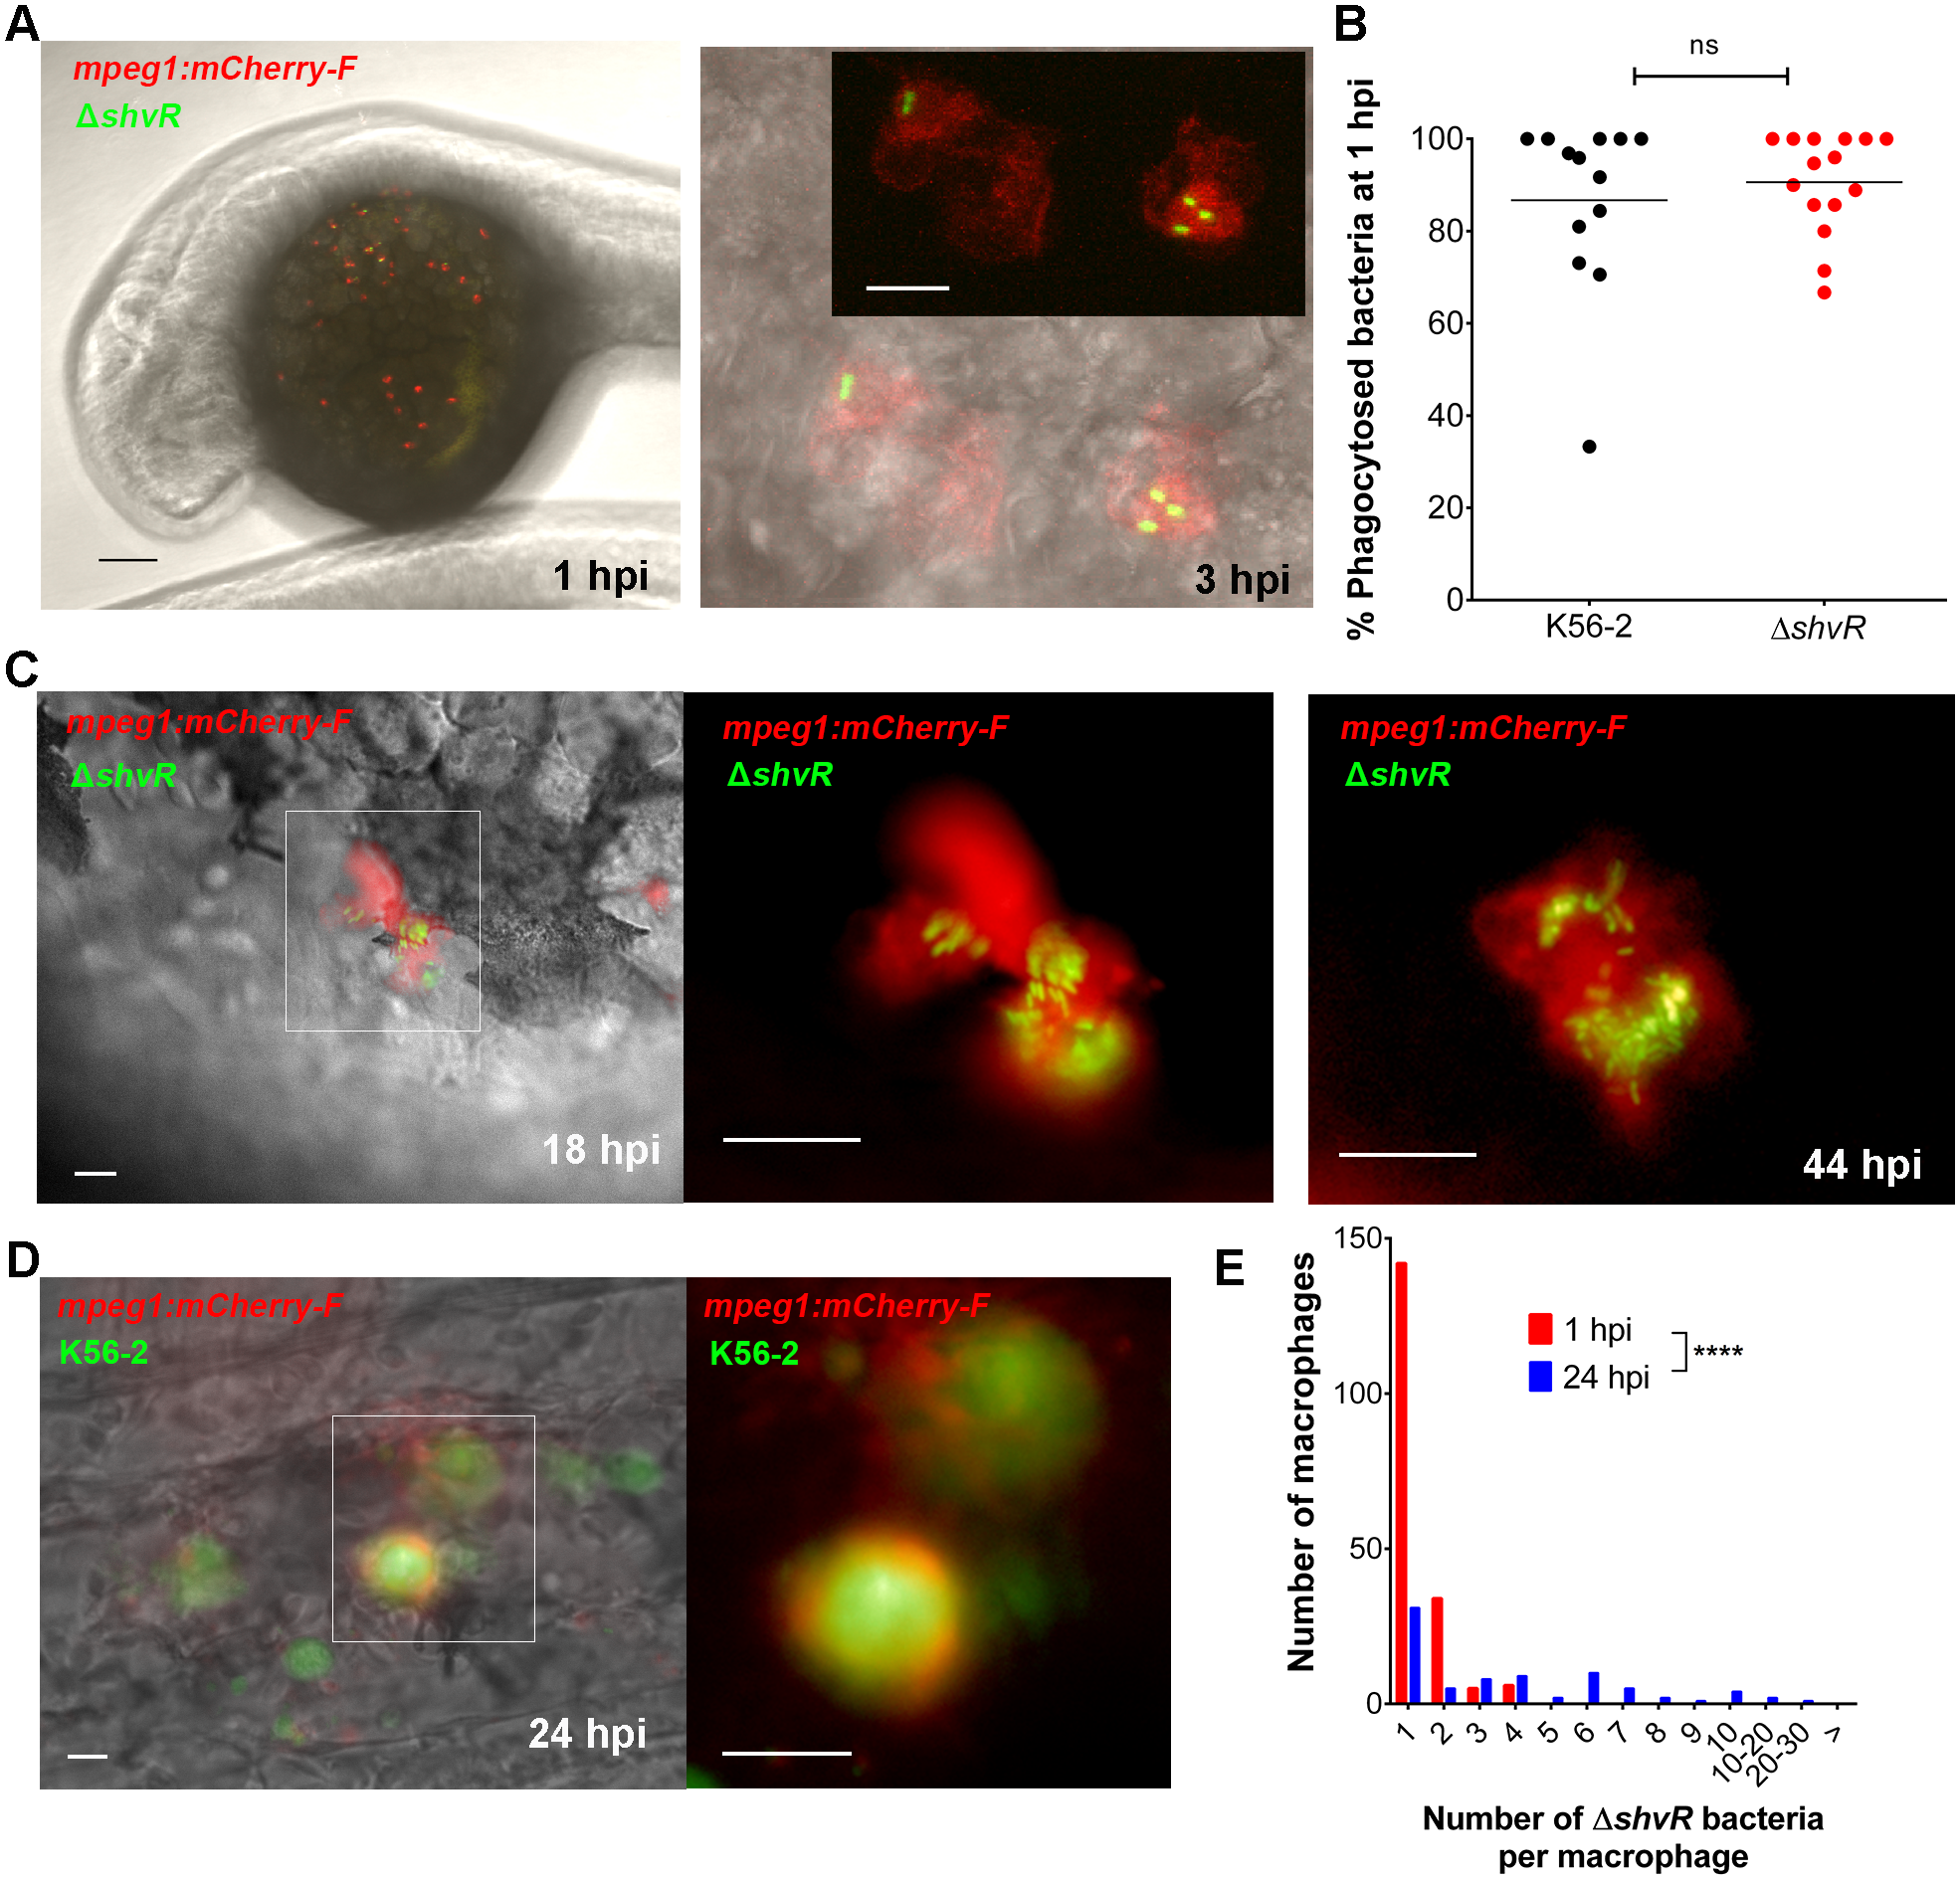
Fig. 2 ΔshvR mutant bacteria are able to persist and replicate in macrophages. (A) Tg(mpeg1:mCherry-F) embryos were injected intravenously at 30 h post fertilization with ~50 CFU ΔshvR bacteria expressing eGFP (pIN301). Left panel: Confocal stack image over the yolk region of a representative embryo (macrophages marked in red) at 1 hpi. Scale bar 100 μm. Right panel: Detailed confocal (bright field and fluorescent overlay) image stack of two macrophages at 3 hpi containing 2 and 3 ΔshvR bacteria, respectively. Inset shows red and green channels only. Scale bar 10 μm. S1 Movie shows a video of the individual (21) sequential images. (B) Quantification of intracellular and extracellular bacteria in PFA-fixed embryos at 1 hpi over the yolk as indicated in Fig 2A using confocal microscopy. Each data point represents an individual Tg(mpeg1:mCherry-F) transgenic embryo injected intravenously with either wildtype B. cenocepacia K56-2 (black dots, n = 13) or ΔshvR (red dots, n = 15) expressing eGFP. Counts per embryo are presented as percentage of internalized bacteria relative to total numbers of bacteria in the yolk sac region. A total of 220 and 141 bacteria were counted for K56-2 and ΔshvR, respectively. Unpaired t-test, with mean 86.7 ± 5.3 and 90.6 ± 2.8, respectively, p-value 0.51. Data in (A, B) are representative of two independent experiments. (C) Tg(mpeg1:mCherry-F) embryos were injected with ΔshvR expressing eGFP. Images of an infected macrophage at 18 hpi over the yolk (left, bright field and fluorescent overlay image; enlarged inset, red and green overlay) and at 44 hpi (red and green overlay image) with high numbers of intracellular bacteria (representative of at least 5 embryos per treatment in more than 3 experiments). Scale bars, 12.5 μm. (D) Tg(mpeg1:mCherry-F) embryos were injected with K56-2 wildtype expressing eGFP. Image of an infection site at 24 hpi in the tail region (left, bright field and fluorescent overlay image; enlarged inset, red and green overlay) with high numbers of bacteria. Scale bars, 12.5 μm. (E) Quantification of the number of intracellular ΔshvR bacteria per macrophage in PFA-fixed embryos at 1 hpi (mean: 1.3 ± 0.05 bacteria per macrophage) and 24 hpi (4.1 ± 0.47 SEM), presented as frequency distribution histogram. The graph represents a total of 187 (15 embryos) and 80 macrophages (10 embryos), at 1 and 24 hpi respectively. Mann Whitney test p < 0.0001. Representative of 2 experiments.