
- Title
-
Ribose-5-Phosphate Isomerase A Overexpression Promotes Liver Cancer Development in Transgenic Zebrafish via Activation of ERK and β-catenin Pathways
- Authors
- Chou, Y.T., Chen, L.Y., Tsai, S.L., Tu, H.C., Lu, J.W., Ciou, S.C., Wang, H.D., Yuh, C.H.
- Source
- Full text @ Carcinogenesis
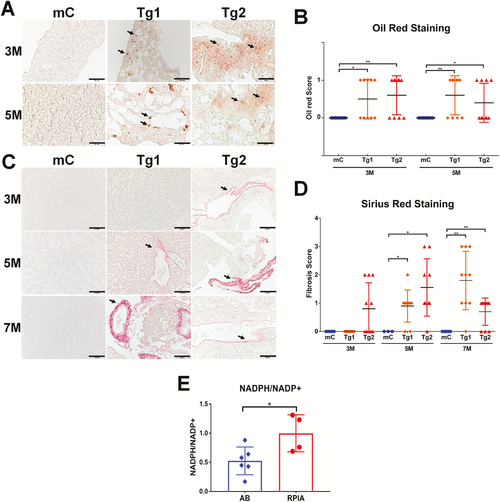
Steatosis and fibrosis develop in RPIA-transgenic zebrafish. (A) Representative pictures of Oil Red O staining results from liver tissues of 3- and 5-month-old control (fabp10a: EGFP-mCherry, mC) and two Tg (fabp10a: RPIA) lines (Tg1 and Tg2) magnified ×400. Scale bar: 50 μm. (B) Statistical analysis of the Oil Red O staining results for the 3- and 5-month-old RPIA Tg 1 (orange diamond) and Tg2 (red triangle) compared with the control fish (mC, blue). Ten fish from each group were analyzed. (C) Representative image of Sirius Red staining results of the 3- to 7- month-old control (mC) and two RPIA-transgenic fish (Tg1 and Tg2). Control fish exhibited no staining while 7-month-old Tg1 fish and 5-month-old Tg2 fish displayed positive signs of fibrosis, which are shown in red. All of the magnifications were ×400. Scale bar: 50 μm (D) Statistical analysis of the Sirius Red staining results for the 3-, 5- and 7-month-old RPIA Tg 1 (orange diamond) and Tg2 (red triangle) compared with the control fish (mC, blue). (E) The ratio of NADPH/NADP+ was elevated in 5-month-old RPIA-transgenic zebrafish. P < 0.05 was considered to be statistically significant; *: 0.01 < P ≤ 0.05. |
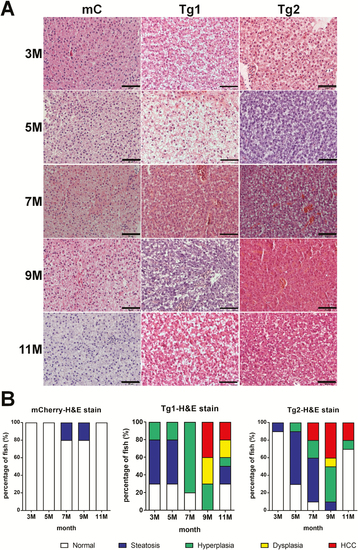
RPIA-transgenic zebrafish develop steatosis, hyperplasia, dysplasia and HCC at earlier stages than control transgenic zebrafish. (A) Representative images of H&E staining from livers of controls and the two transgenic RPIA lines between 3- and 11-month-old fish. All of the magnifications were ×400. Scale bar: 50 μm. (B) Statistical analysis of H&E stain from 3 to 11 months of control fish (mCherry) and two lines of RPIA-transgenic fish (Tg1 and Tg2). N = 10 for each stage. Tg1 developed HCC as early as 9-month old, while Tg2 developed HCC as early as 7-month old. PHENOTYPE:
|
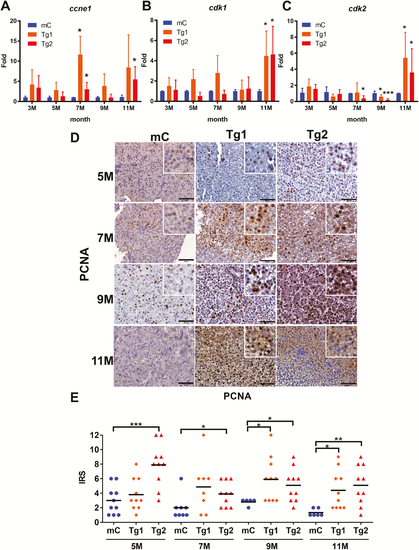
RPIA-transgenic fish increase expression of cell cycle/proliferation markers and PCNA nuclear staining. (A–C) QPCR was used to measure the relative mRNA fold induction of the cell cycle/proliferation markers ccne1, cdk1 and cdk2 in two independent lines of RPIA-transgenic fish (Tg1 and Tg2) compared with the control fish (mC) at 3, 5, 7, 9 and 11 months of age. (D) Representative images of PCNA IHC result for the control (mC) and Tg1 and Tg2 fish aged 5–11 months. All of the magnifications were ×400. Scale bar: 50 μm. (E) Statistical analysis of the PCNA IHC staining results from Tg1 and Tg2 compared with control, as determined by the IRS scoring system. Statistical analysis was performed by two-tailed Student’s t-tests. The symbol ‘*’ represents significance between RPIA-transgenic fish and GFP-mCherry control. P < 0.05 was considered to be statistically significant; *: 0.01 < P ≤ 0.05; **: 0.001 < P ≤ 0.01; ***: P ≤ 0.001. |
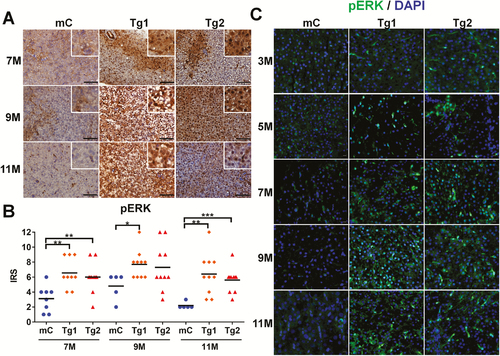
pERK expression is elevated in RPIA-transgenic fish. (A) Representative images of pERK IHC results for the control (mC), and two RPIA-transgenic fish (Tg1 and Tg2) aged 7–11 months. The control fish displayed only a weak pERK signal. The 7- to 11-month-old Tg1 and Tg2 fish exhibited significant stronger staining. All the magnifications were ×400. Scale bar: 50 μm. (B) Statistical analysis of the IHC results for pERK expression of two independent Tg (fabp10a: RPIA)—Tg1 and Tg2 compared with control (mC) fish. Statistical analysis was performed by unpaired two-tailed t-tests. Asterisks (*) represent the level of significance. *P < 0.05 was considered statistically significant. **P < 0.01; ***P < 0.001. (C) Immunofluorescence staining of pERK in two independent RPIA-transgenic zebrafish (Tg1 and Tg2) compared with control (mC). The images showed that pERK (green) and DAPI (blue) immunofluorescent signals co-localized within nucleus in RPIA-transgenic zebrafish liver. All of the magnifications were ×400. Scale bar: 40 μm. |
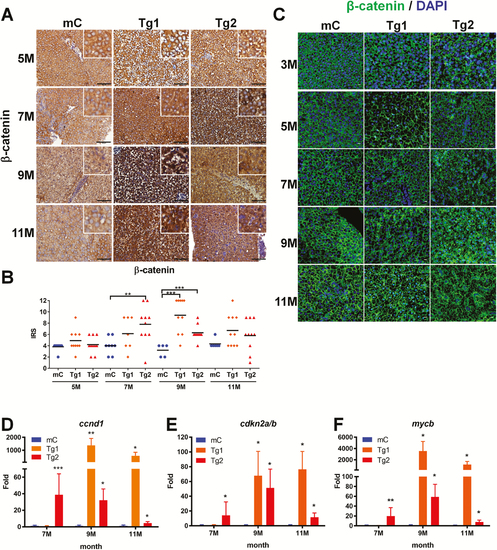
The expression of β-catenin and downstream target genes was upregulated in RPIA-transgenic fish aged 7–11 months. (A) Representative images of β-catenin IHC staining from 5 to 11 months of control (mC), Tg1- and Tg2-RPIA-transgenic fish. A weaker β-catenin signal was detected in transgenic, control tissues (mC) relative to tissues from the RPIA-transgenic fish, and staining in the control fish revealed expression in the area surrounding the nucleus. In the 9 and 11 months of Tg (fabp10a: RPIA) fish lines, the amount of β-catenin in nucleus was upregulated. All of the magnifications were ×400. Scale bar: 50 μm. (B) Statistical analysis of β-catenin immunostaining in 5- to 11-month-old Tg1- and Tg2-RPIA-transgenic fish compared with control. Statistical analysis was performed by unpaired two-tailed t-tests. Asterisks (*) represent the level of significance. *P < 0.05 was considered statistically significant. **P < 0.01; ***P < 0.001. N = 10 each stage. (C) Immunofluorescence staining of β-catenin in Tg1- and Tg2-RPIA-transgenic zebrafish compared with control (mC). The images showed that β-catenin (green) lost the expression for cell junction and co-localized with DAPI (blue) within nucleus in RPIA-transgenic zebrafish liver. All of the magnifications were ×400. Scale bar: 40 μm. (D–F) QPCR was used to measure the induction of the β-catenin target genes ccnd1 (D), cdkn2a/b (E), and mycb (F) in two independent lines of Tg (fabp10a: RPIA), which compared with control fish (mC) aged 3, 5, 7, 9 and 11 months. A significant increase in the expression levels of β-catenin target genes was found in 9- to 11-month-old Tg1 and 7- to 9-month-old Tg2 transgenic fish as compared with the transgenic control fish (mCherry). Statistical analysis was performed by unpaired two-tailed t-tests. Asterisks (*) represent the level of significance. *P < 0.05 was considered statistically significant. **P < 0.01; ***P < 0.001. N = 10 each stage. EXPRESSION / LABELING:
|
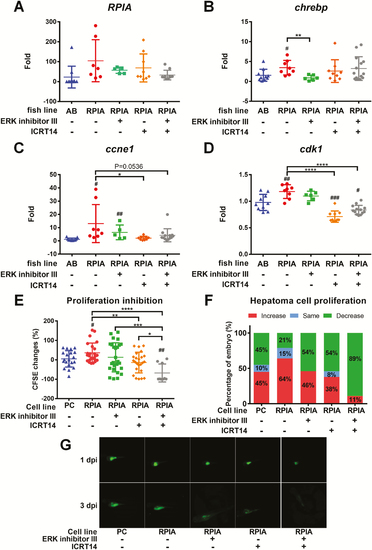
ERK inhibition diminished lipogenesis while β-Catenin inhibition reverted cellular proliferation in zebrafish. (A–D) QPCR was used to measure the relative mRNA fold induction of RPIA, lipogenic factor (chrebp) and cell cycle/proliferation markers (ccne1 and cdk1) in two independent lines of Tg (fabp10a: RPIA) compared with the control fish (mC) after ERK inhibitor III and β-catenin inhibitor (ICRT14) treatment by oral feeding. (E) PLC5 with RPIA-overexpressed cells proliferation ability was examined by xenotransplantation assay. The CFSE‐labeled cells were injected to 2-day-old embryos. PLC5 was pretreated with ERK inhibitor and β-catenin inhibitor or mixture of these two inhibitors for 24 h before injection. The cell proliferation was analyzed between 1 and 3 dpi. RPIA-overexpressed PLC5 (RPIA) has higher proliferation rate than the empty vector control (pcDNA3; PC). β-catenin inhibition (ICRT14) significantly reduced RPIA-expressed cell proliferation ability. Statistical analysis was performed by unpaired two-tailed t-tests with Welch’s correction. P < 0.05 was considered to be statistically significant. Hashtag (#) represented the comparison between RPIA-transgenic lines and AB; Asterisk (*) represented the comparison between RPIA Tg lines with and without inhibitor treatment. #0.01 < P ≤ 0.05; ###P ≤ 0.001; **0.001 < P ≤ 0.01; ****P ≤ 0.0001. (F) The percentage of embryos with increased, the same or decreased CFSE‐labeled cells compared between 3 and 1 dpi. β-catenin inhibition decreased the proportion of fish with RPIA-induced proliferative cells. Combination of β-catenin and ERK inhibitors revealed synergistic inhibition on RPIA-induced cell proliferation. (G) Representative fluorescence images of xenotransplanted zebrafish at 1 and 3 dpi for each treatment. |

ZFIN is incorporating published figure images and captions as part of an ongoing project. Figures from some publications have not yet been curated, or are not available for display because of copyright restrictions. |
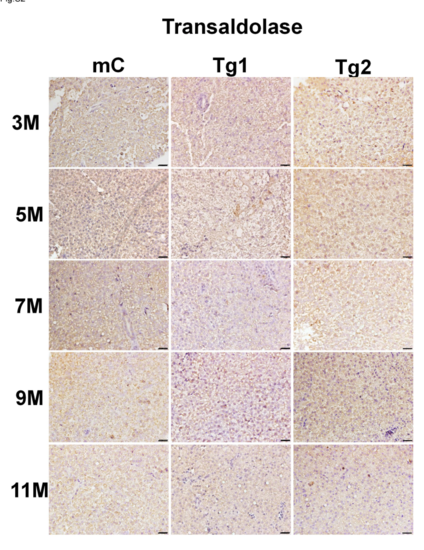
Transaldolase Expression Level is not Affected by the Overexpression of RPIA in Transgenic Zebrafish. Transaldolase (TALDO) protein levels in the hepatocytes of two RPIA transgenic fish (Tg1 and Tg2) and control fish (mC) were measured by immunohistochemistry analysis. The transaldolase protein levels were not different between RPIA transgenic fish and control fish aged five to nine months. All of the magnifications were 400X. Scale bar: 40 μm. |
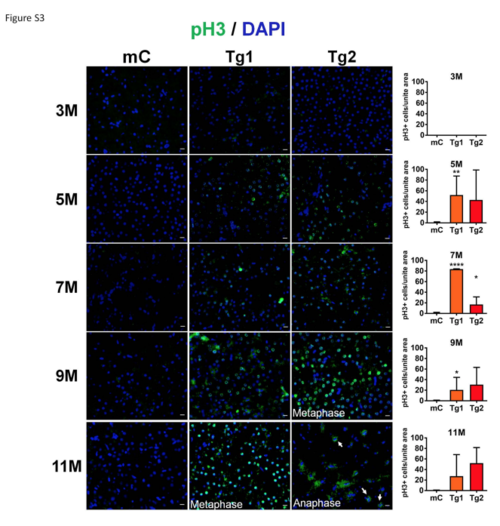
Phosphorylation of Histone 3 at Ser10 (pH3) is Elevated in RPIA Transgenic Zebrafish Representative immunofluorescent images of pH3 (green) were showed for control (mC), and two RPIA transgenic fish (Tg1 and Tg2). The location of pH3 with DAPI (blue) took place in nucleus in transgenic liver sections from five months. In eleven months of Tg1 and nine months of Tg2, the significant stronger pH3 signals were observed. In eleven months of Tg2, the dividing cells were revealed as anaphase in transgenic liver. All the magnifications were 400X. Scale bar: 40 μm. The numbers of pH3-positive cells per united area were shown next to the representative images. |
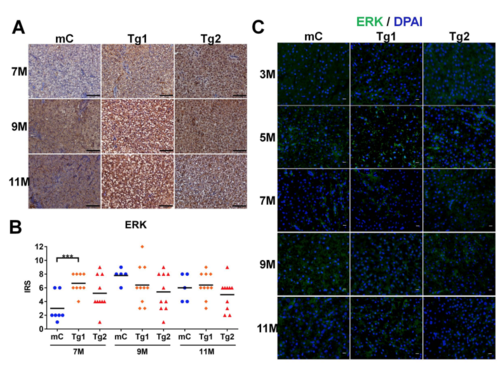
Total ERK Expression Level is not Affected by the Overexpression of RPIA in Transgenic Zebrafish. (A) Representative images of ERK IHC results for the control (mC) and two RPIA transgenic fish (Tg1 and Tg2) aged 7 to 11 months. (B) Statistical analysis of the IHC results for ERK expression of Tg1 and Tg2 compared to control fish. There are no significant statistical differences of ERK expression except during the seventh month. (C) Immunofluorescence staining of ERK in two independent RPIA-transgenic zebrafish (Tg1 and Tg2) compared to control (mC). The images showed that ERK (green) levels were not upregulated and colocalized with DAPI (blue) within nucleus in RPIA-transgenic zebrafish liver. All the magnifications were 400X. Scale bar: 40 μm. |
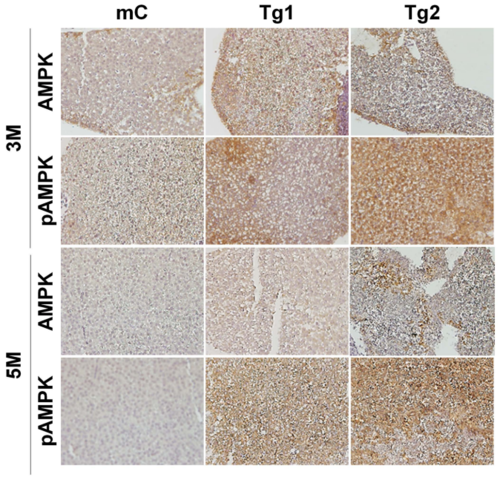
pAMPK Expression Level is Increased in RPIA-Transgenic Fish. The protein levels of pAMPK and total AMPK protein levels in two RPIA transgenic (Tg1 and Tg2) and control (mC) fish were measured by immunohistochemistry analysis. The pAMPK protein levels were up-regulated in RPIA transgenic fish compared to control fish, but AMPK protein levels were not altered. All the magnifications were 400X. |