
|
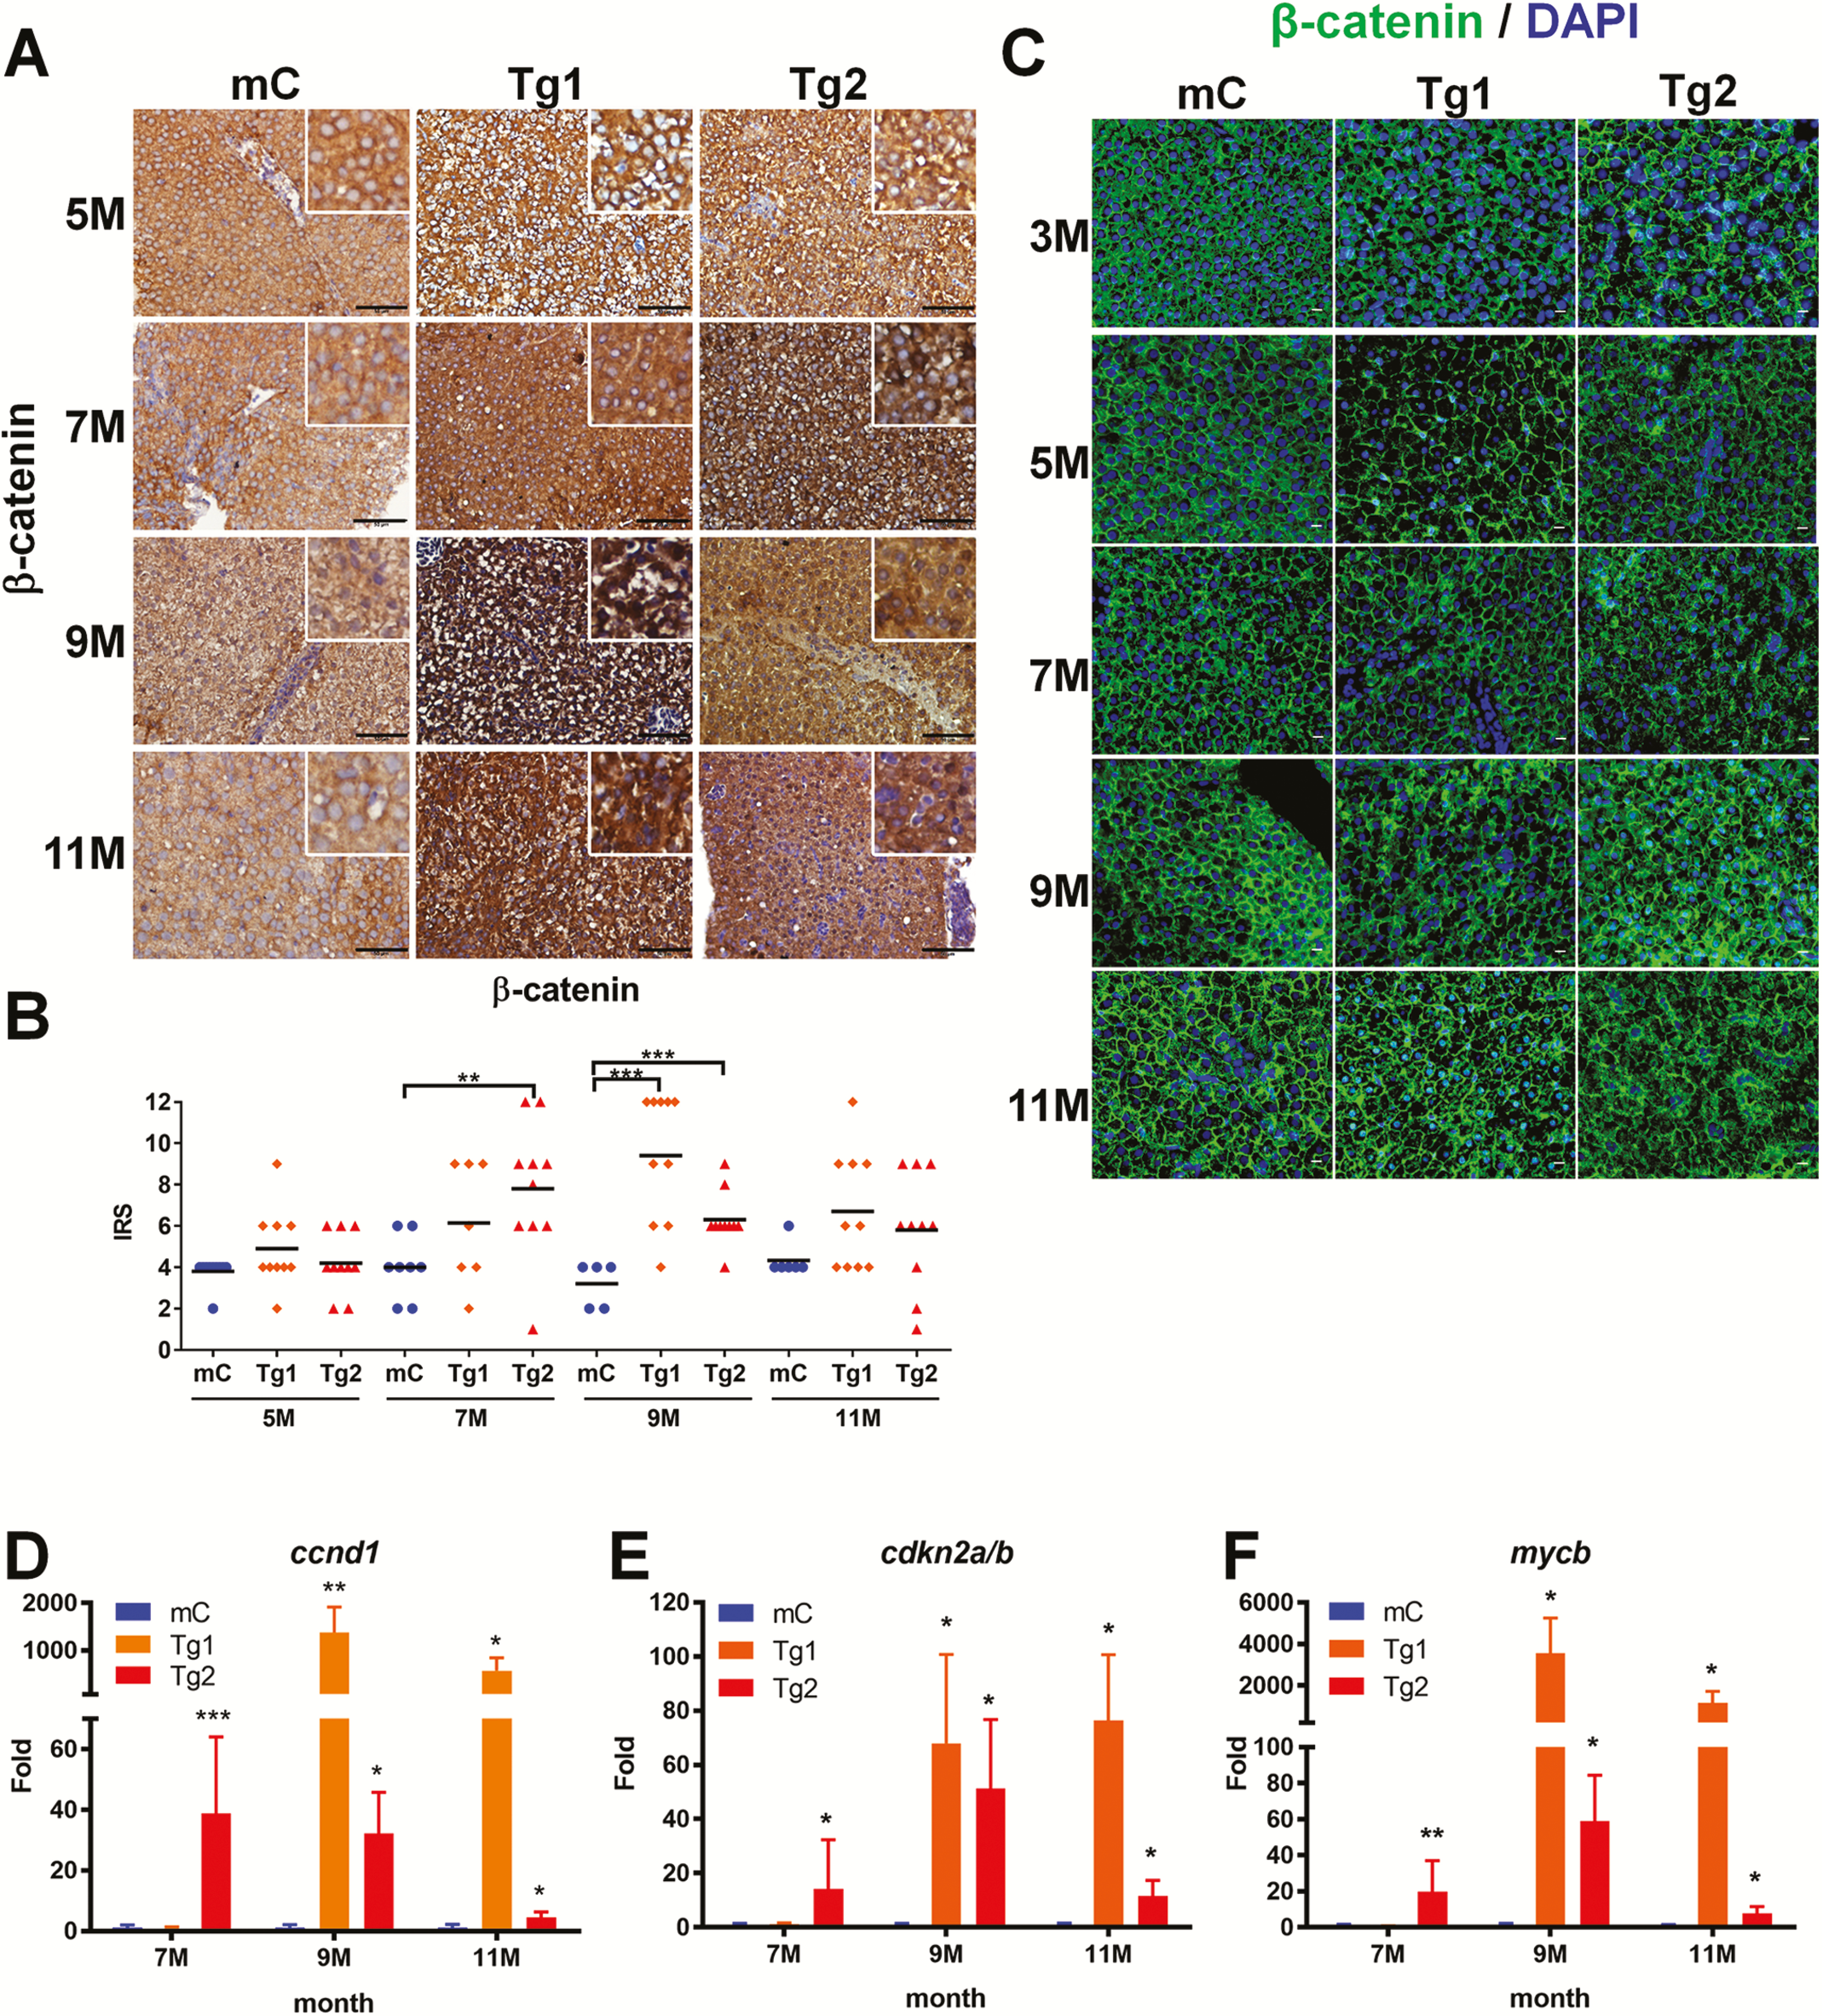
Fig. 5 The expression of β-catenin and downstream target genes was upregulated in RPIA-transgenic fish aged 7–11 months. (A) Representative images of β-catenin IHC staining from 5 to 11 months of control (mC), Tg1- and Tg2-RPIA-transgenic fish. A weaker β-catenin signal was detected in transgenic, control tissues (mC) relative to tissues from the RPIA-transgenic fish, and staining in the control fish revealed expression in the area surrounding the nucleus. In the 9 and 11 months of Tg (fabp10a: RPIA) fish lines, the amount of β-catenin in nucleus was upregulated. All of the magnifications were ×400. Scale bar: 50 μm. (B) Statistical analysis of β-catenin immunostaining in 5- to 11-month-old Tg1- and Tg2-RPIA-transgenic fish compared with control. Statistical analysis was performed by unpaired two-tailed t-tests. Asterisks (*) represent the level of significance. *P < 0.05 was considered statistically significant. **P < 0.01; ***P < 0.001. N = 10 each stage. (C) Immunofluorescence staining of β-catenin in Tg1- and Tg2-RPIA-transgenic zebrafish compared with control (mC). The images showed that β-catenin (green) lost the expression for cell junction and co-localized with DAPI (blue) within nucleus in RPIA-transgenic zebrafish liver. All of the magnifications were ×400. Scale bar: 40 μm. (D–F) QPCR was used to measure the induction of the β-catenin target genes ccnd1 (D), cdkn2a/b (E), and mycb (F) in two independent lines of Tg (fabp10a: RPIA), which compared with control fish (mC) aged 3, 5, 7, 9 and 11 months. A significant increase in the expression levels of β-catenin target genes was found in 9- to 11-month-old Tg1 and 7- to 9-month-old Tg2 transgenic fish as compared with the transgenic control fish (mCherry). Statistical analysis was performed by unpaired two-tailed t-tests. Asterisks (*) represent the level of significance. *P < 0.05 was considered statistically significant. **P < 0.01; ***P < 0.001. N = 10 each stage.