
- Title
-
Color opponency with a single kind of bistable opsin in the zebrafish pineal organ
- Authors
- Wada, S., Shen, B., Kawano-Yamashita, E., Nagata, T., Hibi, M., Tamotsu, S., Koyanagi, M., Terakita, A.
- Source
- Full text @ Proc. Natl. Acad. Sci. USA
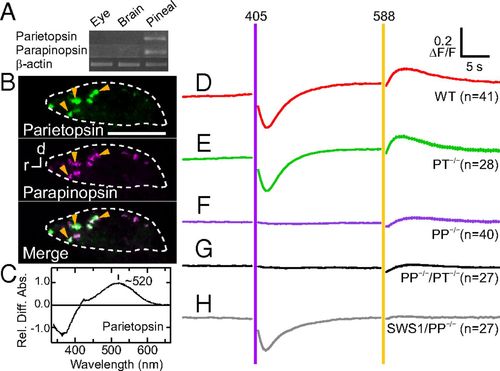
Contribution of opsins to color opponency in PP cells under two-photon imaging. (A) RT-PCR analyses of parietopsin and parapinopsin expression in the eye, brain, and pineal organ of zebrafish. (B) In situ hybridization analyses of two opsins in the zebrafish pineal organ using the double fluorescence method. Yellow arrowheads in B indicate coexpression of two opsins in the zebrafish pineal organ. Orientations marked with “d” and “r” indicate the dorsal and rostral sides, respectively. The white dotted traces indicate the landmarks of the pineal organ. (Scale bars: 100 µm.) (C) Relative difference absorption spectrum of zebrafish parietopsin before minus after light irradiation. The spectrum is shown as an average of three measurements. (D–H) Calcium level changes upon 405- or 588-nm light stimuli in PP cells of WT (D; n = 41), parietopsin-KO (E; PT−/−, n = 28), parapinopsin-KO (F; PP−/−, n = 40), double-KO (G; PP−/−/PT−/−, n = 27), and SWS1 opsin-expressing/parapinopsin-KO fish (H; SWS1/PP−/−, n = 27). Error bars indicate SE. The light intensities of 405- and 588-nm light stimuli in D–H were ∼3.2 × 10¹⁴ and ∼5.4 × 10¹⁷ photons per cm2·s, respectively. The durations of both stimuli were ∼450 ms. ∆F/F values are change rates of normalized fluorescence intensity with the averaged intensity of 10 points before initial light stimuli. Statistical evaluation of the differences in amplitudes of calcium level changes among the WT and mutants are shown in SI Appendix, Fig. S5 A and B. |

ZFIN is incorporating published figure images and captions as part of an ongoing project. Figures from some publications have not yet been curated, or are not available for display because of copyright restrictions. |

Localization of parietopsin and Go in PP cells. (A) In situ hybridization indicating co-localization of parietopsin mRNA and GFP mRNA expression under control of the upstream DNA sequence of PP, supporting colocalization of parietopsin and PP as shown in Figure 2B. The white dotted traces indicate the landmarks of the pineal organ. Scale bars, 100 μm. (B) Immunohistochemical analysis using the antibody against the alpha subunit of Go type-G protein. 20 μm-frozen Sections of the pineal organ obtained from transgenic fish expressing EGFP (PP-GFP, green) in PP cells were incubated with 1:200 diluted anti-Goα (MBL International, Woburn, MA, USA), followed by incubation with 1:500 diluted Alexa Fluor 594 antirabbit IgG (Thermo Fisher Scientific, Inc.) for immunofluorescence detection (Go, magenta). The merged image demonstrates that Go is localized in PP cells (yellow arrowheads). Note that anti-Go antibody labels “cell membranes” of PP cells exhibiting EGFP fluorescence within their “cell bodies” and cell membranes of ganglion cells without EGFP fluorescence. Orientations marked with d and r indicate the dorsal and rostral sides, respectively. The white dotted traces indicate the landmarks of the pineal organ. (Insets) High-magnification images from different slices. Scale bars, 20 μm. |